Your Hiring Pulse report for September 2021
We’re in a pretty crazy time in terms of hiring and business in general. Some sectors are struggling to find candidates, and others are overloaded with applicants. Likewise, some functions are hiring faster than ever, whereas others are seeing less-than-stellar response and engagement in their hiring.

We know that data trends are important to you when recruiting. You and your hiring team want to know whether the trends you’re seeing in your own processes are ‘normal’. But it no longer makes sense to go back to historical data – read: pre-pandemic – as a measuring stick.
Even year-over-year and month-over-month data doesn’t make sense either, due to the dramatic spikes and valleys we’re seeing in the job market – let alone the craziness that was 2020.
So, instead, we’re taking a new approach so you can make the most informed decisions as an SMB employer when assessing your own data.
Jump ahead:
- The Hiring Pulse: Methodology
- Main highlights
- Time to Fill
- Total Job Openings
- Candidates per Hire
- So what’s the conclusion here?
The Hiring Pulse: Methodology
To bring the best insights to small and medium businesses worldwide, here’s what we’re doing with our data: when looking at a specific month’s trend, we’re taking the numbers from that month and comparing it to the average of the three previous months – and showing as a percentage how that month looks in comparison.
For example, if July shows an average Time to Fill of 30 days for all jobs, and the monthly average for the three preceding months (April, May, June) is 25 days, we present the result for July as a 20% increase.
Got it? Great. To start, we’re looking at the worldwide trends for three common hiring metrics: Time to Fill, Total Job Openings, and Candidates per Hire. The majority of the data is sourced from small and medium businesses across the Workable network, making it a powerful resource for SMBs when planning their own hiring strategy.
Stay tuned for more immersive analysis in the coming months – including industry-specific, function-specific, and location-specific reports.
Main highlights
The three main highlights for this month are:
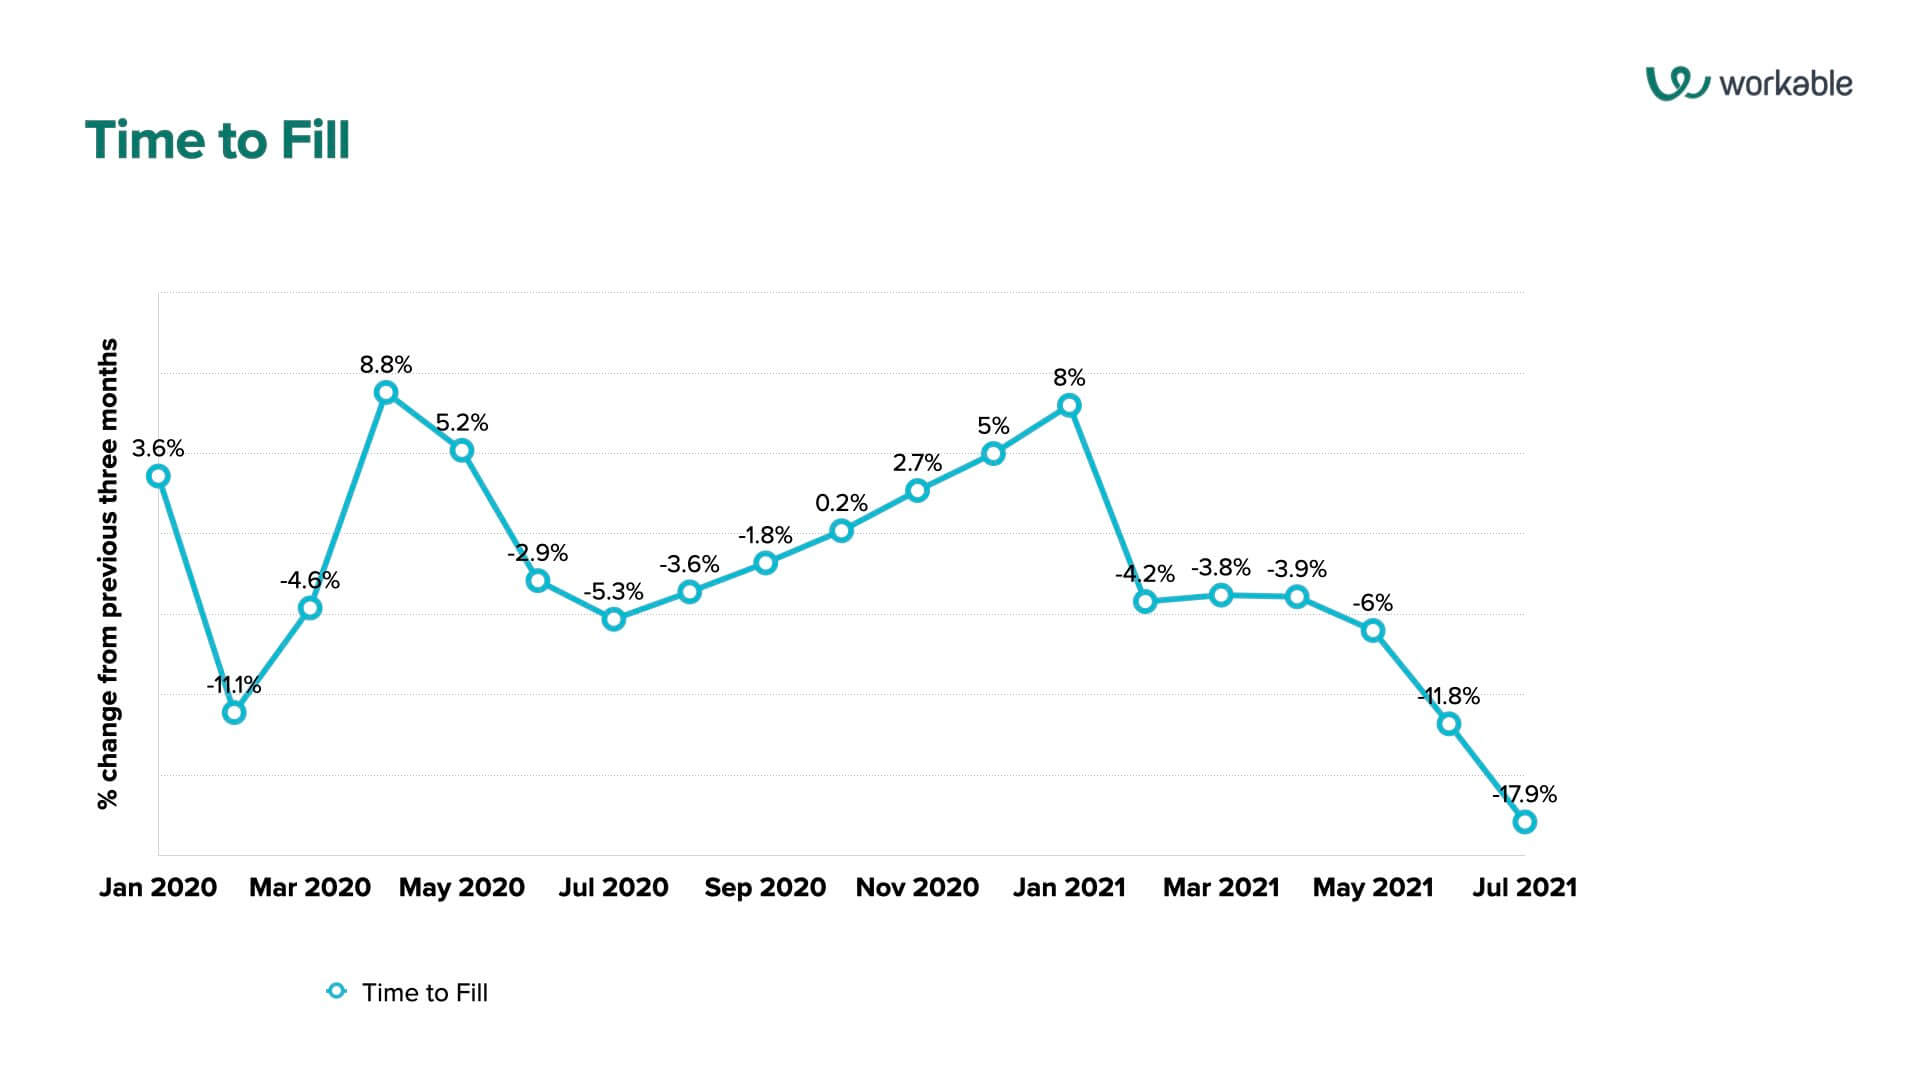
- A sharp downward trend in Time to Fill starting in Q2 2021
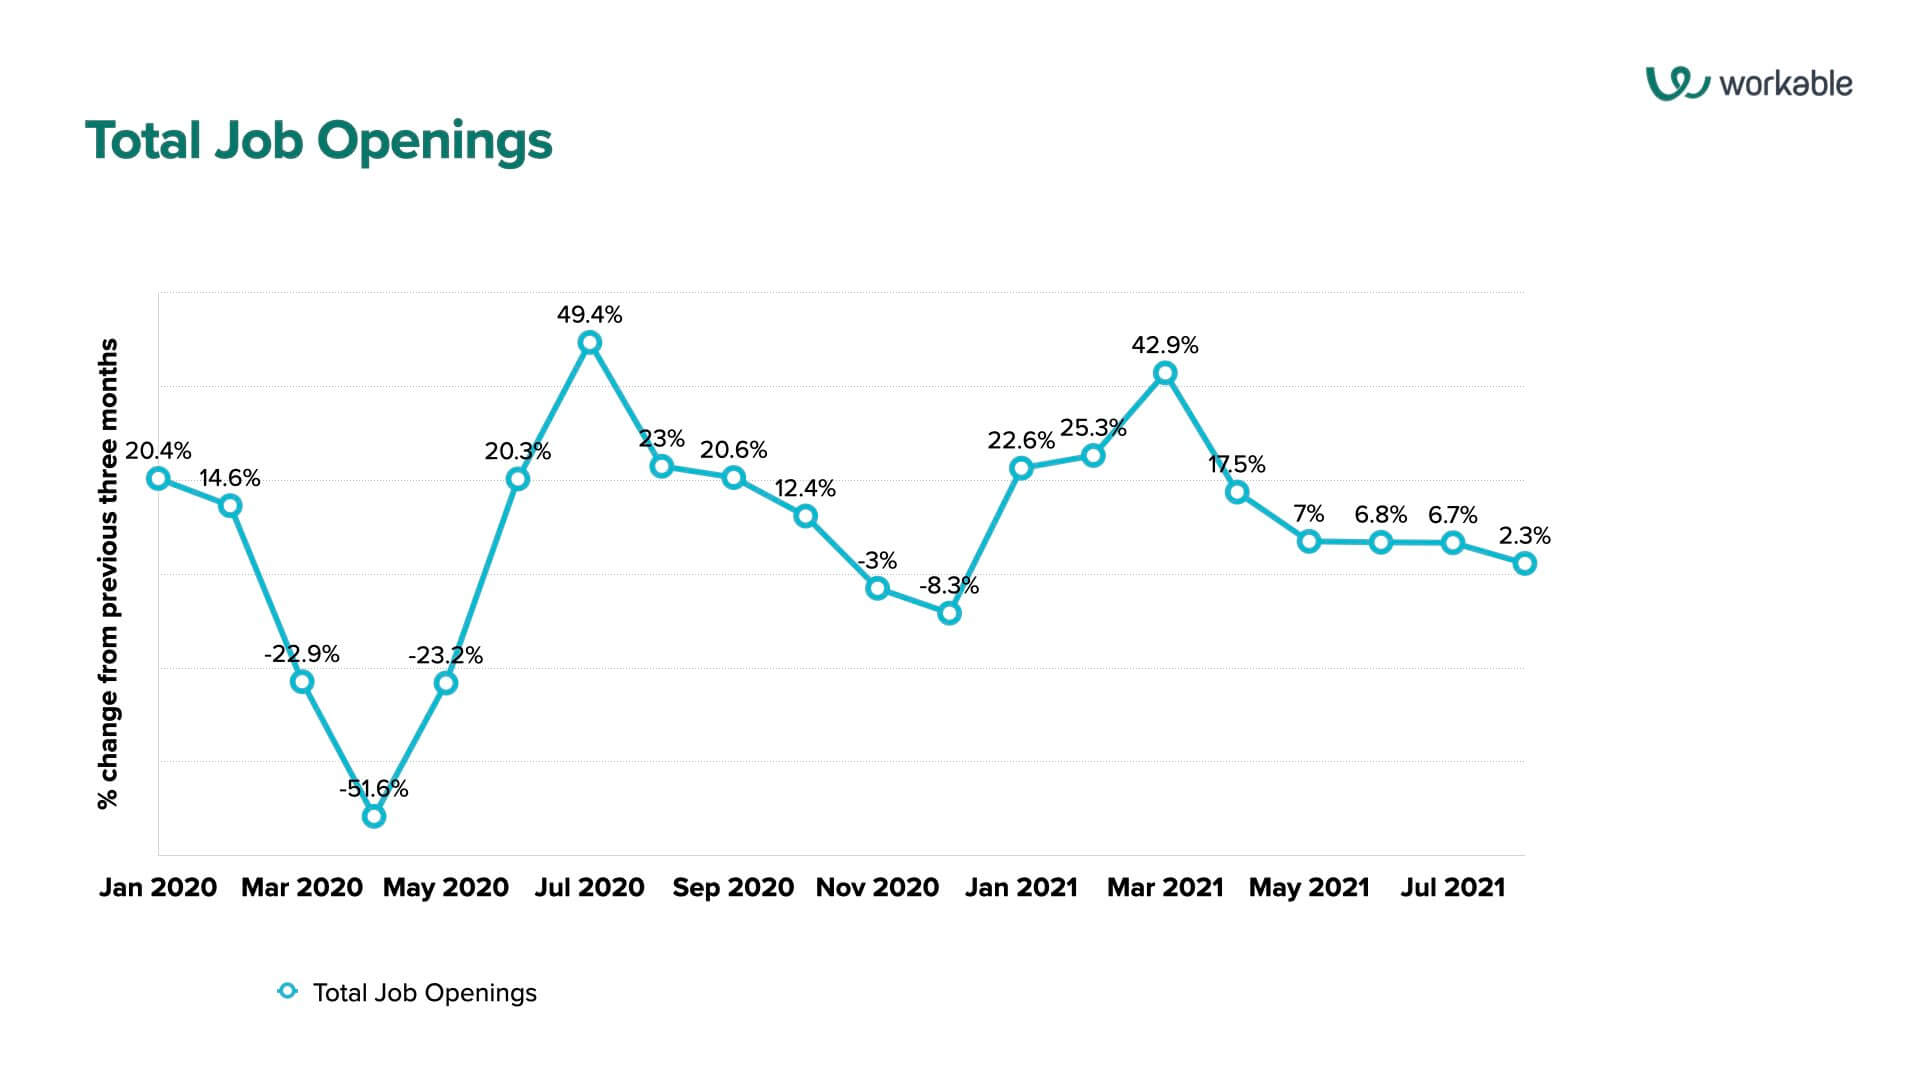
- A significant spike in job openings in March 2021, followed by steady growth in job opening numbers every month after that
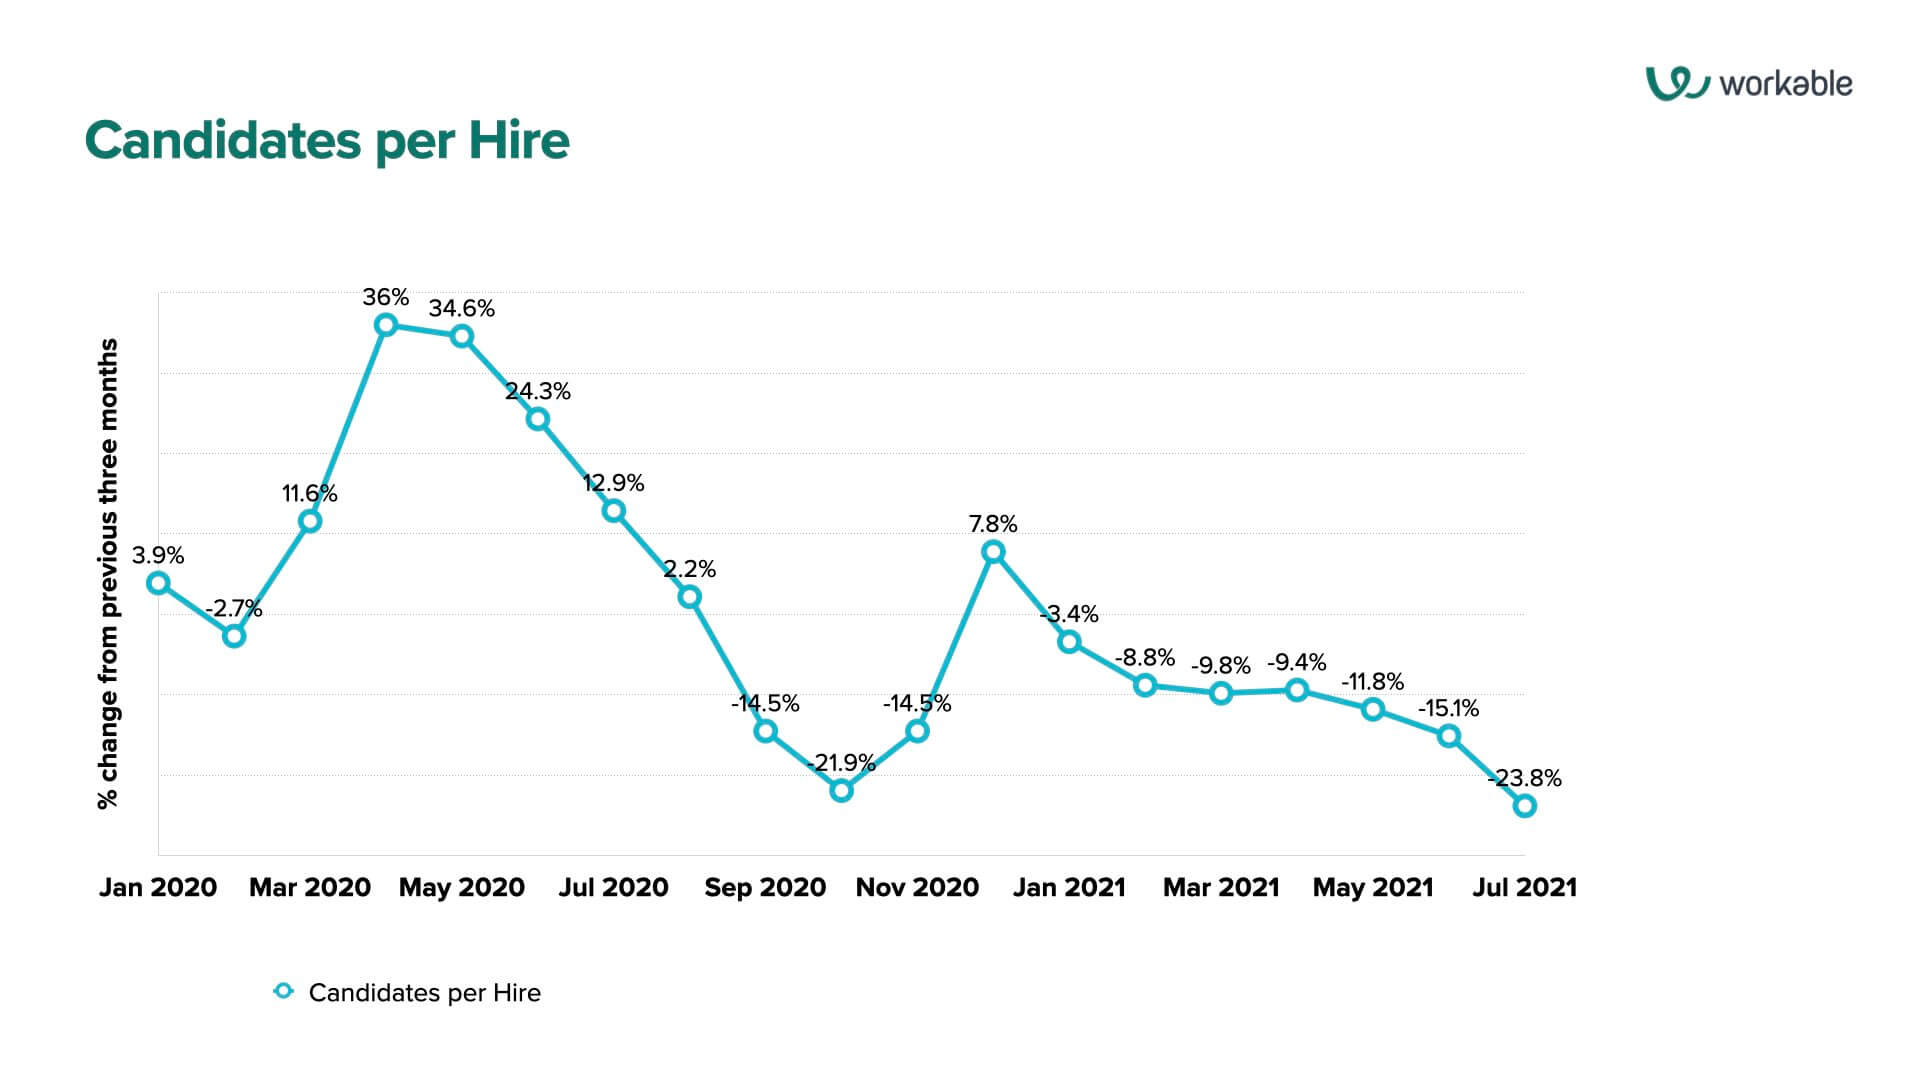
- A drop in average candidates per hire every single month in 2021 – and dropping more significantly throughout Q2 2020
1. Time to Fill
For this report, Workable defines “Time to Fill” as the number of days from when a new job is opened to when that job opening is filled.
As you can see in the graph below, first of all, there’s a dramatic spike in Time to Fill coinciding with the start of the pandemic – more than likely due to many new job openings being put on hold in response to economic uncertainty.
But there’s also a clear upward trajectory in Time to Fill starting at the end of Q2 2020, followed by a dramatic downward trend in Time to Fill at the start of 2021 – and especially in Q2 2021. (Note that these trends are based on a trailing three-month average, making these changes even more dramatic.)
Let’s speculate a bit here, starting with the upward trends from mid-2020 to end 2020. We have three explanations in mind:
- The recruitment process is managed by leaner teams and budgets due to drastic cutbacks in Q2 2020 – therefore slowing down the overall recruitment process.
- The spike in unemployment in Q2 2020 contributed to a higher number of candidates per job opening – requiring more time to sift through candidate pools for a job.
- The upwards trend towards the end of 2020 is due to slowdown in day-to-day work including the hiring process due to the holiday season.
And what about the drastic drop in Time to Fill trends in 2021? Again, we have three thoughts:
- With the economy opening up again, businesses started hiring/re-hiring more quickly.
- The lessons of 2020 include the need for more agile, nimbler processes requiring quicker turnaround, including in hiring.
- Businesses are now hiring for stop-gap; to fill immediate needs in addition to longer-term solutions – especially when navigating a more volatile and unpredictable business environment.
(NOTE: You’re probably wondering why we stopped the numbers in July. That’s because the data is based on the time the job was opened, not when it was filled. For instance, the Time to Fill for a job opening published on August 15 would be 15 days or less – therefore skewing the data. So we’ve omitted August for this chart.)
Let’s go to the next metric: overall job openings.
2. Total Job Openings
Total job openings represent the total number of job openings activated across the entire Workable network.
What we see is a significant decline in job opening trends starting with the pandemic followed by an equally dramatic spike in the trend in Q2 2020 as the economy started to reopen after the first wave of COVID cases.
But then the numbers return to a negative trend towards the end of 2020 worldwide, which can be attributed to two factors: the exponential growth in COVID cases worldwide and particularly throughout the US and the UK, combined with the usual slowdown of day-to-day business into the holiday season.
We then see positive growth in job openings starting in January 2021, climaxing in March which saw a 42.9% increase in job postings over the previous three-month average.
Again, this is made more significant as it’s based on a rolling average of the past three months. Even as the trend appears to taper off going into Q2 2021, this chart actually show job openings are continuing to grow at an approximate 7% clip every month.
This indicates a revitalized job market. When businesses are hiring, that signals a healthier economy and growth – at first glance anyway.
With that, let’s now look at the Candidates per Hire.
3. Candidates per Hire
Workable defines the number of candidates per hire as, succinctly, the number of applicants for a job up to the point of that job being filled.
In 2020, we see the expected spike in candidates per hire with the start of the pandemic – after all, as a basic rule of thumb, mass layoffs lead to higher numbers of applicants. And this trend slows down towards the end of 2020, going into a negative trajectory in Q4.
But in 2021 even to July, we see a consistently negative trend in candidates per hire every single month. That downward trajectory doesn’t show any signs of slowing down.
(NOTE: Again, you’re probably wondering why we stopped the numbers in July. Again, as stated above, that’s because these data are based on the time the job was opened, not when it was filled.)
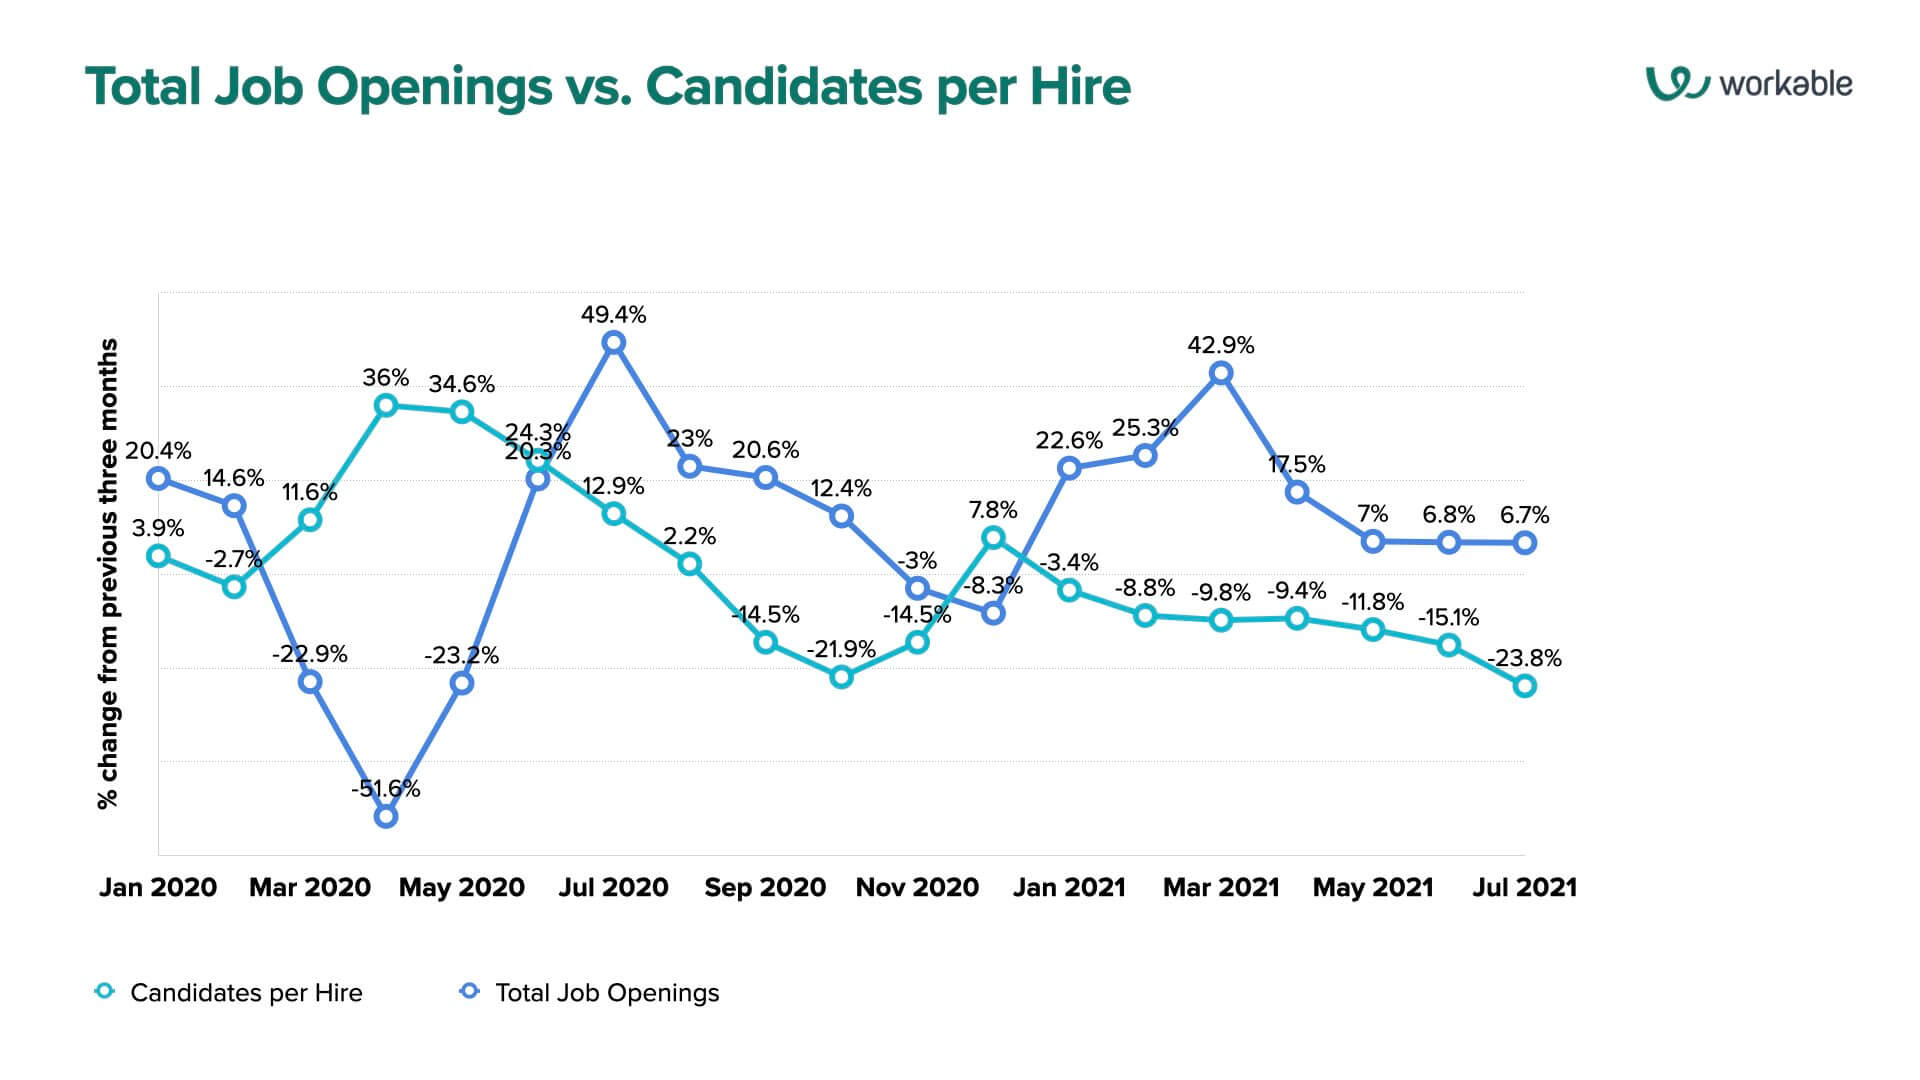
Let’s now look at both job openings and candidates per hire as an overlay. In 2020, we see some correlation between the drop in job openings and the drop in candidates per hire – understandable, because fewer job openings indicates more jobs being filled, leading to more candidates finding work, ultimately leading to fewer people looking for work.
We can theorize a little deeper, although that’s a good basic explanation for 2020’s trends. But then we look at 2021 data, and we’re not seeing that same correlation. This year, job openings are still trending upwards, but candidates per hire are trending downwards.
What’s going on here? Well, there has been a lot of talk about the “Great Resignation” and unprecedented quit rates in recent months. Let’s wrap up with a conversation on this topic.
So what’s the conclusion here?
A clear observation is that workers are leaving jobs, but they’re not applying for other work. Forbes chalks this up to worker burnout, pointing to the correlation of quit rates with increased productivity.
Perhaps this signals a disconnect between employers and employees. The old way of business isn’t working anymore, and workers are dropping out of the system in a modern version of 1960s counterculture icon Timothy Leary’s famous statement, “Turn on, tune in, drop out.”
To paraphrase Leary from his autobiography, Flashbacks, he explains this statement as first becoming more intimately aware of one’s internal needs and triggers (turn on), connecting with the external world in a more harmonious way (tune in), and finally, committing to one’s own priorities and sense of self (drop out).
In short: workers are finding more meaning in life beyond work, and they’re acting on it. To stay relevant as an employer, you may need to reconsider your employee value proposition because the traditional one no longer resonates in this new world of work.
Thoughts, comments, disagreements? Send them to [email protected], with “Hiring Pulse” in the subject heading. We’ll share the best feedback in an upcoming report. Watch for our next Hiring Pulse on Oct. 5!


