Your Hiring Pulse report for October 2021
In September’s Hiring Pulse, we wrote that we’re in a “pretty crazy time in terms of hiring and business”. Now, we feel like it’s more of a “new time” as we (hopefully) move out of the pandemic. Still, it’s worth looking at the numbers to get a feel for the level of craziness – or normalcy – when it comes to SMB recruitment and hiring.

More specific to you: we know that data trends are important to you when recruiting in the SMB world. You and your hiring team want to know whether the trends you’re seeing in your own processes are ‘normal’. Because we’re not even sure what ‘normal’ is anymore, we’re moving away from year-over-year and month-over-month data because those don’t make sense.
So, we’re taking a fresh approach so you can make the most informed decisions as an SMB employer when assessing your own data.
How we’re looking at data
Remember, we’re looking at trends, not hard numbers. This means we’re showing data as a percentage increase or decrease based on the three trailing months. Jump to the end for a detailed methodology of how we’re doing this.
As always, we look at the worldwide trends for three common SMB hiring metrics:
- Time to Fill (TTF)
- Total Job Openings
- Candidates per Hire (CPH)
And we’re making it more interesting by looking at the data in three specific industries to see how they differ in each.
Table of Contents:
- Time to Fill
- Total Job Openings
- Candidates per Hire
- Industry metrics
- Conclusion
- The Hiring Pulse: Methodology
Main highlights
The three main highlights for this month’s Hiring Pulse are:
- Time to Fill is continuing to drop overall
- Candidates per job are also continuing to drop overall
- Real Estate recruitment data is far more pronounced than overall data, especially in jobs opened and candidates per hire
1. Time to Fill
For this report, Workable defines “Time to Fill” as the number of days from when a new job is opened to when that job opening is filled.
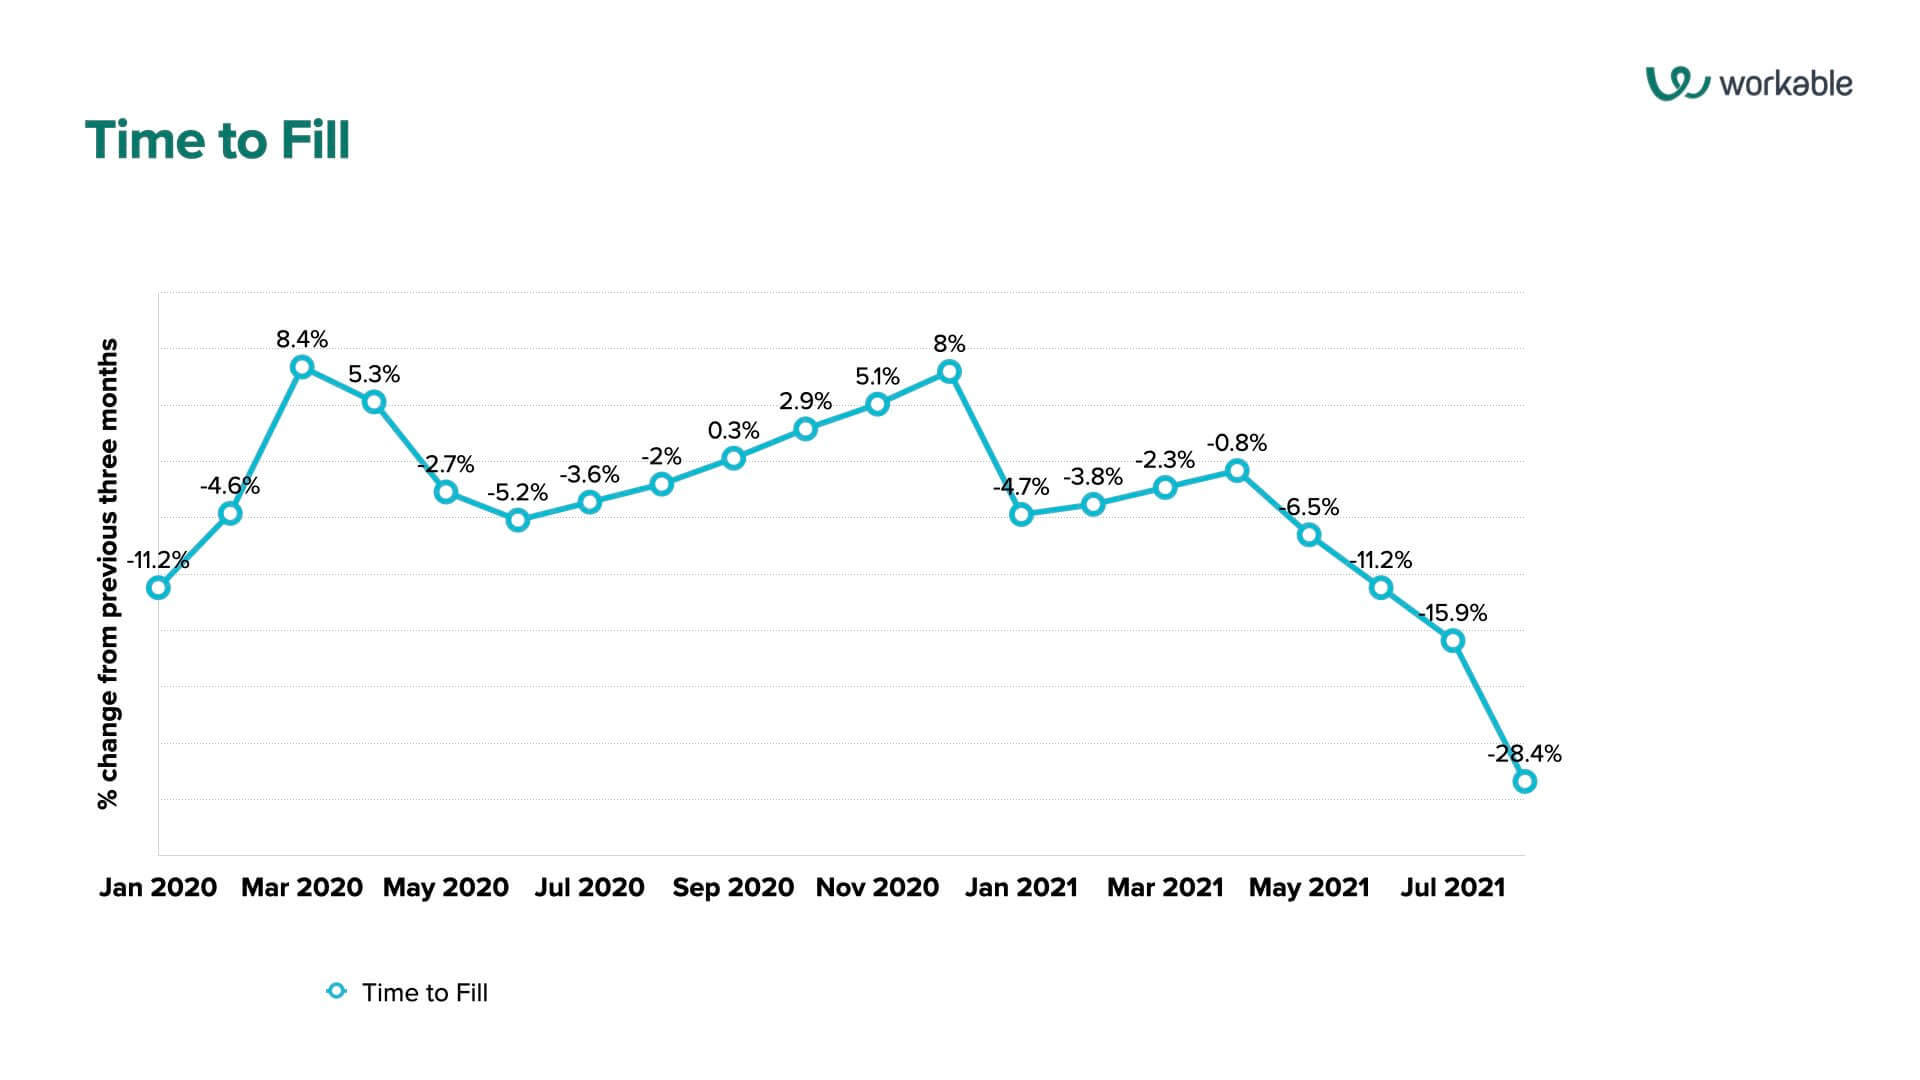
Let’s look at the trend graph for overall Time to Fill …
… and then look at the same graph for the September edition of the Hiring Pulse. You’ll see that the numbers are slightly different across all months – that’s because the data only counts when a job is filled.
It’s important that we understand this distinction: if a job is opened in July but isn’t filled until September, it won’t show up in this graph. If another job is opened on the same day in July but is filled in August, it’ll show up here – which will partially explain the downward trend in TTF numbers in recent months.
But, that being said, in September’s Hiring Pulse, the last month recorded (July 2021) shows a negative TTF trend of -17.9% compared with the trailing three-month average. Here, the last month recorded (August 2021) shows an even more negative trend of -28.4%.
Both include the same variables described in the previous paragraph, so something’s happening here. Time to Fill is steadily dropping overall.
2. Total Job Openings
Total job openings represent the total number of job openings activated across the entire Workable network.
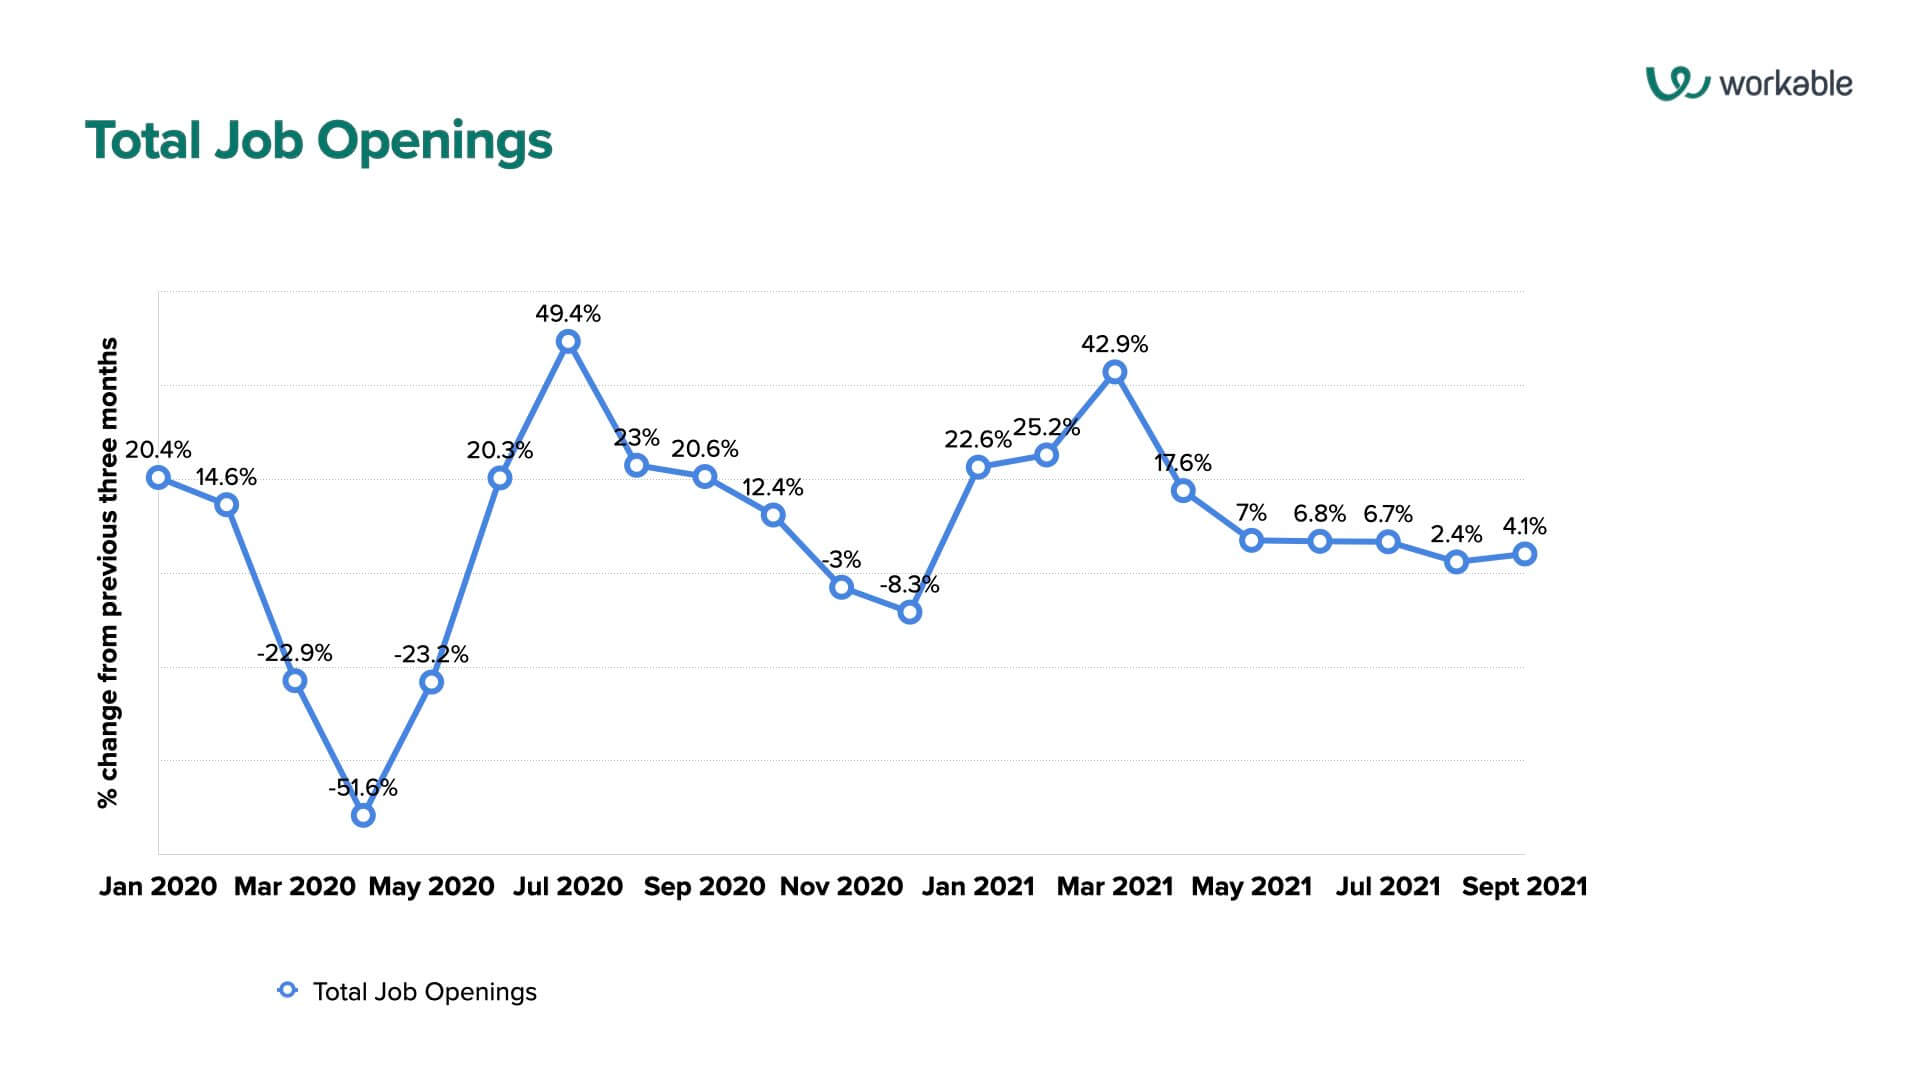
Let’s look at job openings overall, bearing in mind that because these are raw job open numbers, we can include September in this chart.
Note: September is the start of the traditional hiring season as we come out of summer, when post-secondary graduates enter the job market, kids return to school enabling parents to start working, and so on and so forth. Of course, the pandemic throws a particular wrench into this as we see in the data in 2020.
But this time, there’s a gentle uptick in job openings in September 2021 – a 4.1% increase in job openings compared with the average of the three previous months. Healthier economy? Fresh hiring season? Spike in backfills due to the Great Resignation? You decide.
3. Candidates per Hire
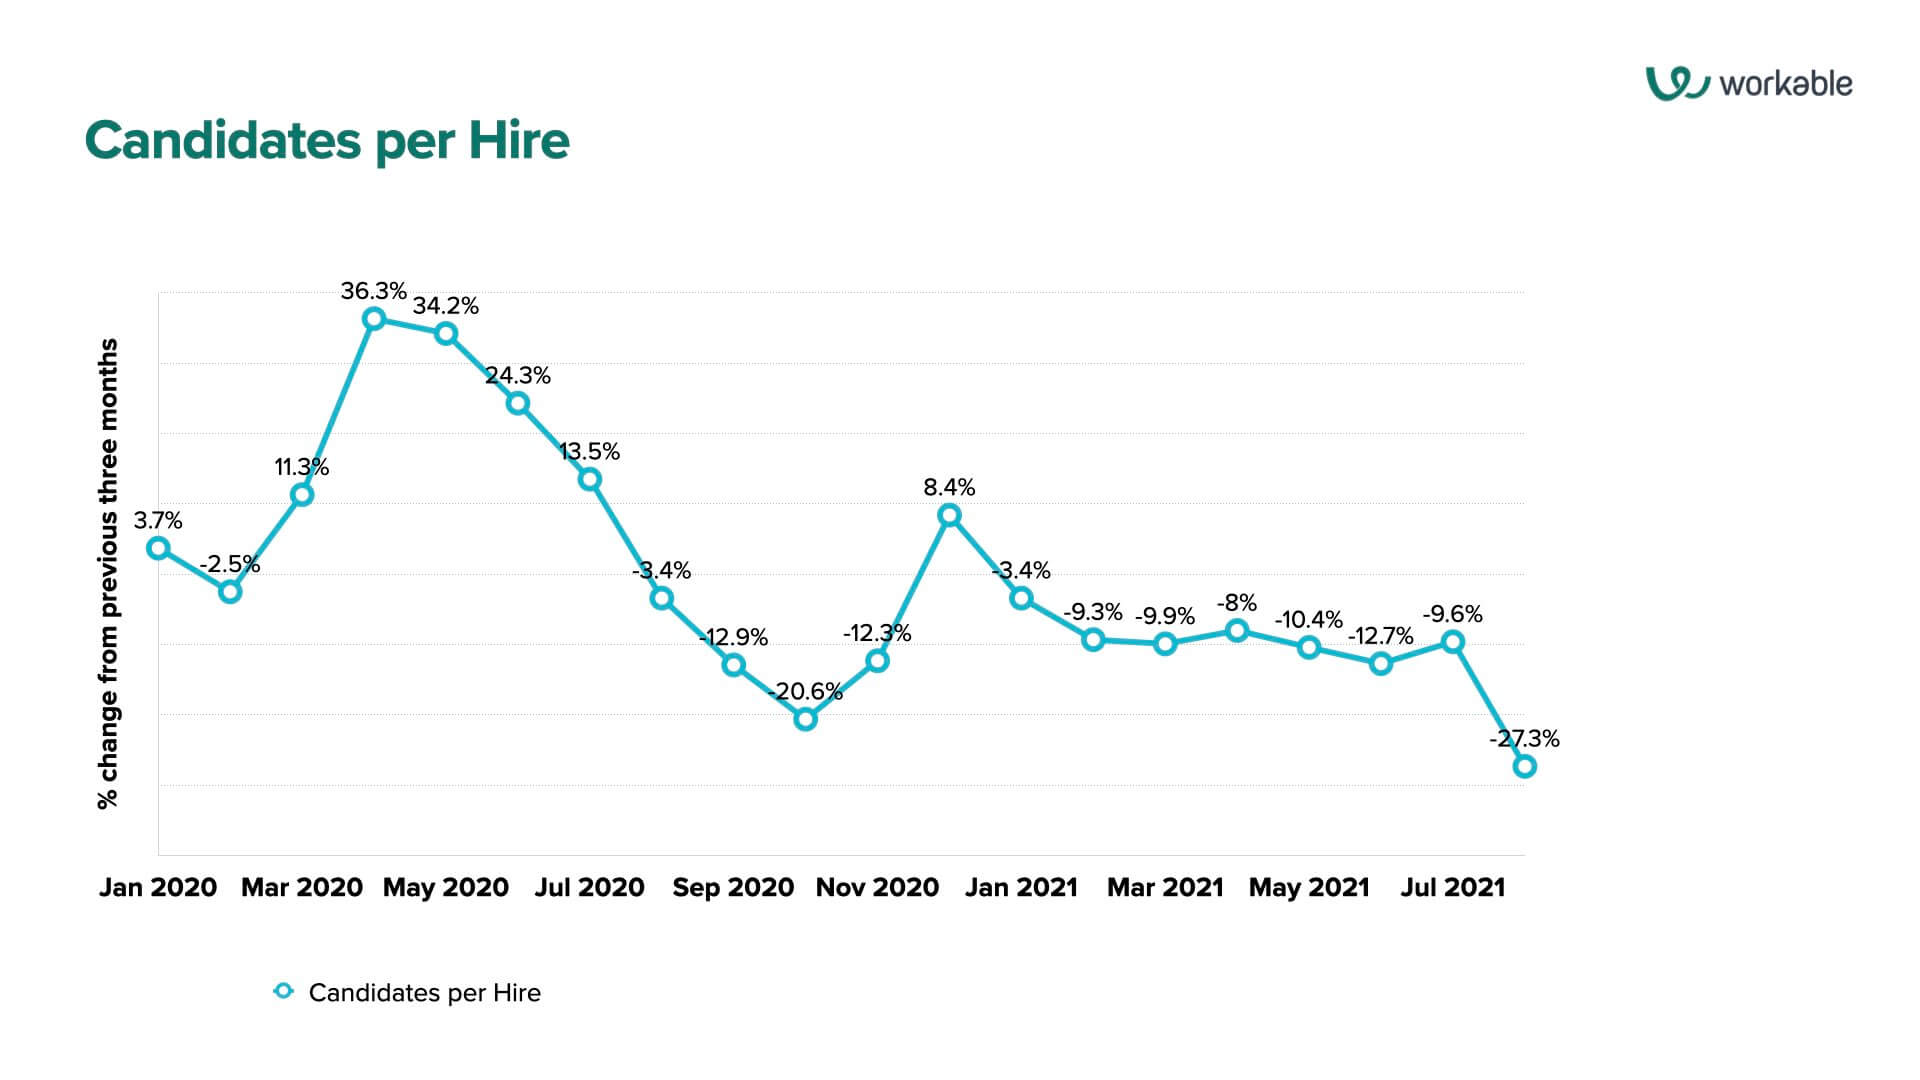
Workable defines the number of candidates per hire as, succinctly, the number of applicants for a job up to the point of that job being filled. Let’s look at what’s going on in the numbers through August:
(NOTE: Again, you’re probably wondering why we stopped the numbers in August. Again, as stated above, that’s because these data are based on the time the job was opened, not when it was filled.)
When you compare with the same graph from September’s Hiring Pulse, you’ll see a little bump in July – because more candidates will show up on the doorstep of a job going into July for a job opened in June. That’ll update the numbers in this new graph a bit.
But as in the Time to FIll chart, the downward trend is sharper in the latest month’s data. Fewer candidates are showing up per job than before.
4. Industry metrics
Now, let’s look at all of the above across three specific industries that are considerably impacted by the pandemic, whether positively or negatively:
Software as a Service (SaaS)
First, let’s look at SaaS. In the early days of the pandemic, digital transformation was fast-tracked by many organizations as teams moved to remote operations and online work. This necessitated new tech for organizations to survive and thrive – especially as emphasized by Deloitte in April 2021 – and concurrently, opened huge windows of opportunity for existing and new SaaS organizations to innovate and grow. Consider the “digital nomad” wave in Europe as described by the Economist, and you have it in a nutshell.
Time to Fill – SaaS
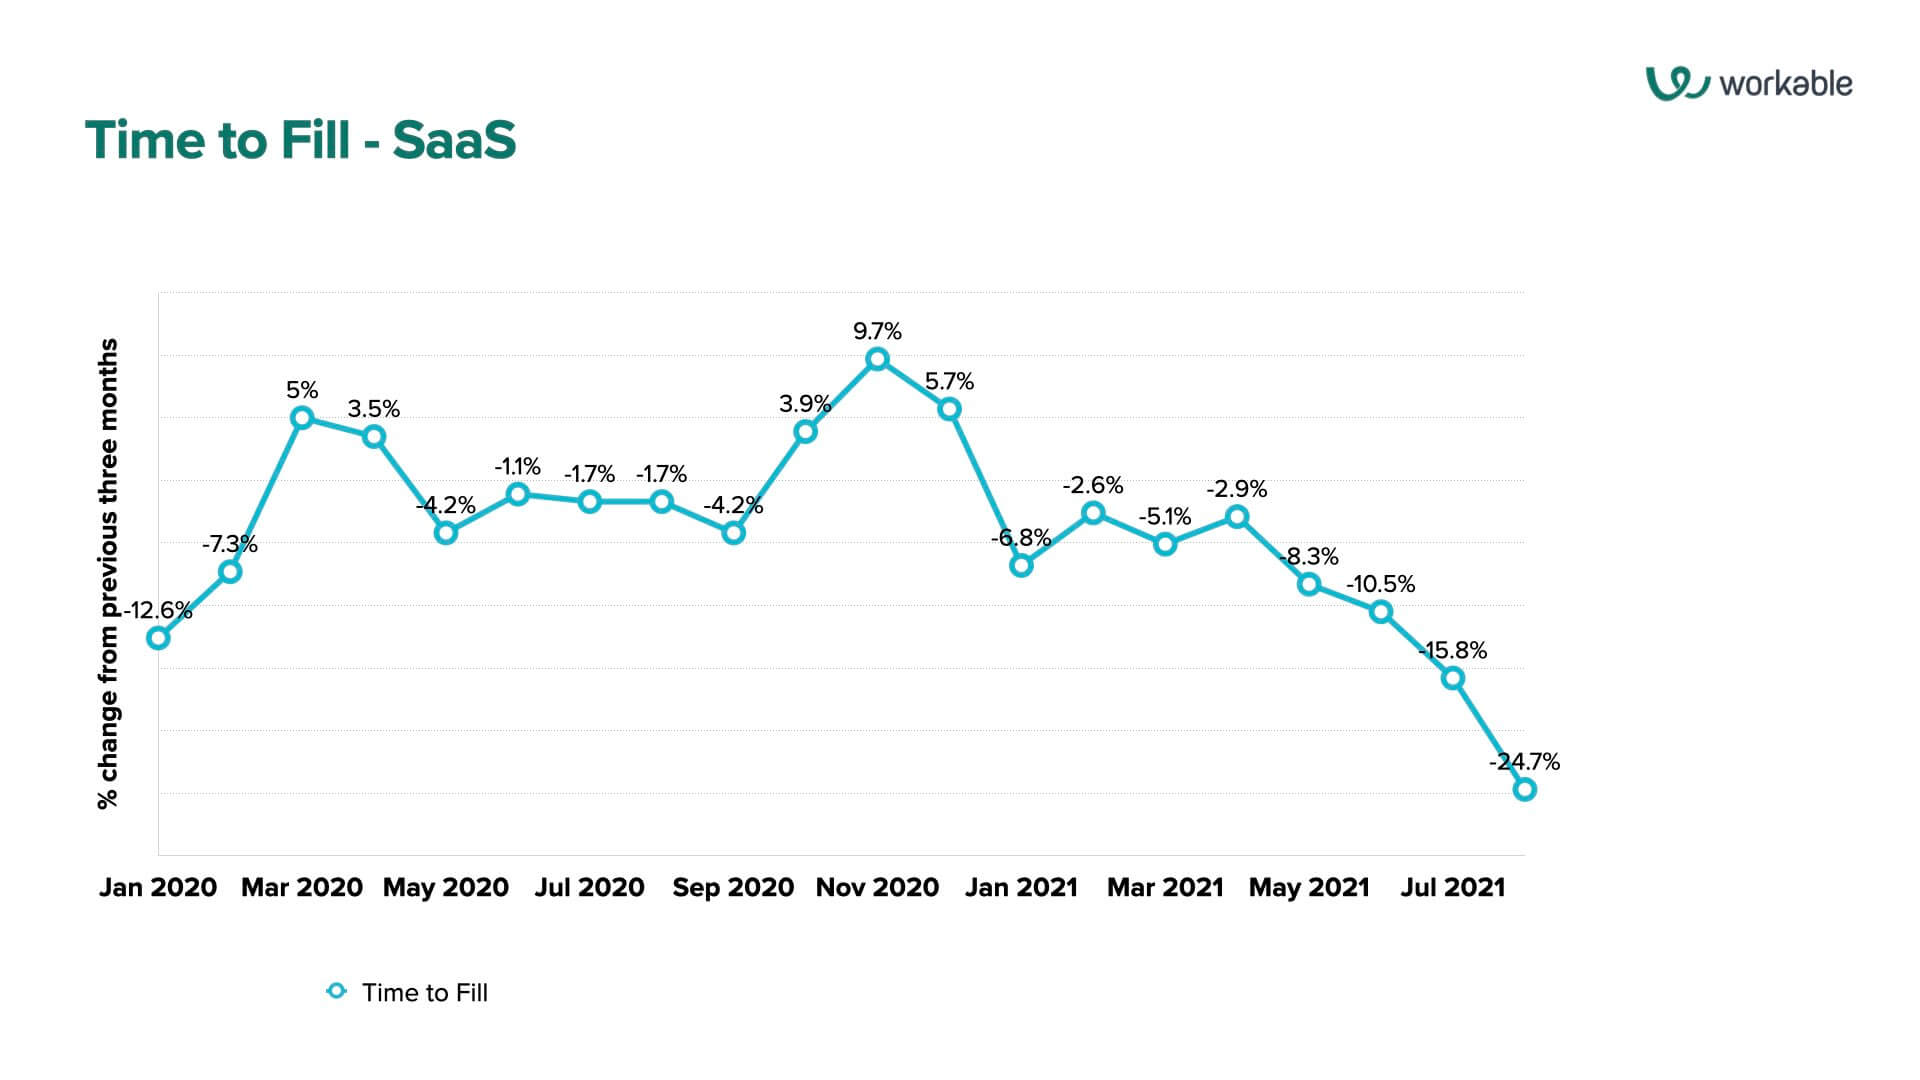
What does all that look like in Workable’s network data? Let’s take a look at Time to Fill:
Clearly, there’s a pandemic marker where TTF numbers shortened in the early days of COVID-19, likely as SaaS companies found it easier to fill roles quickly due to a fresh influx of recently laid-off candidates in the market (see graph below). TTF then sped up throughout 2020 until it started to drop in Q4 2020, and sped up again from the start of 2021 to end of August.
Job Openings & Candidates per Hire – SaaS
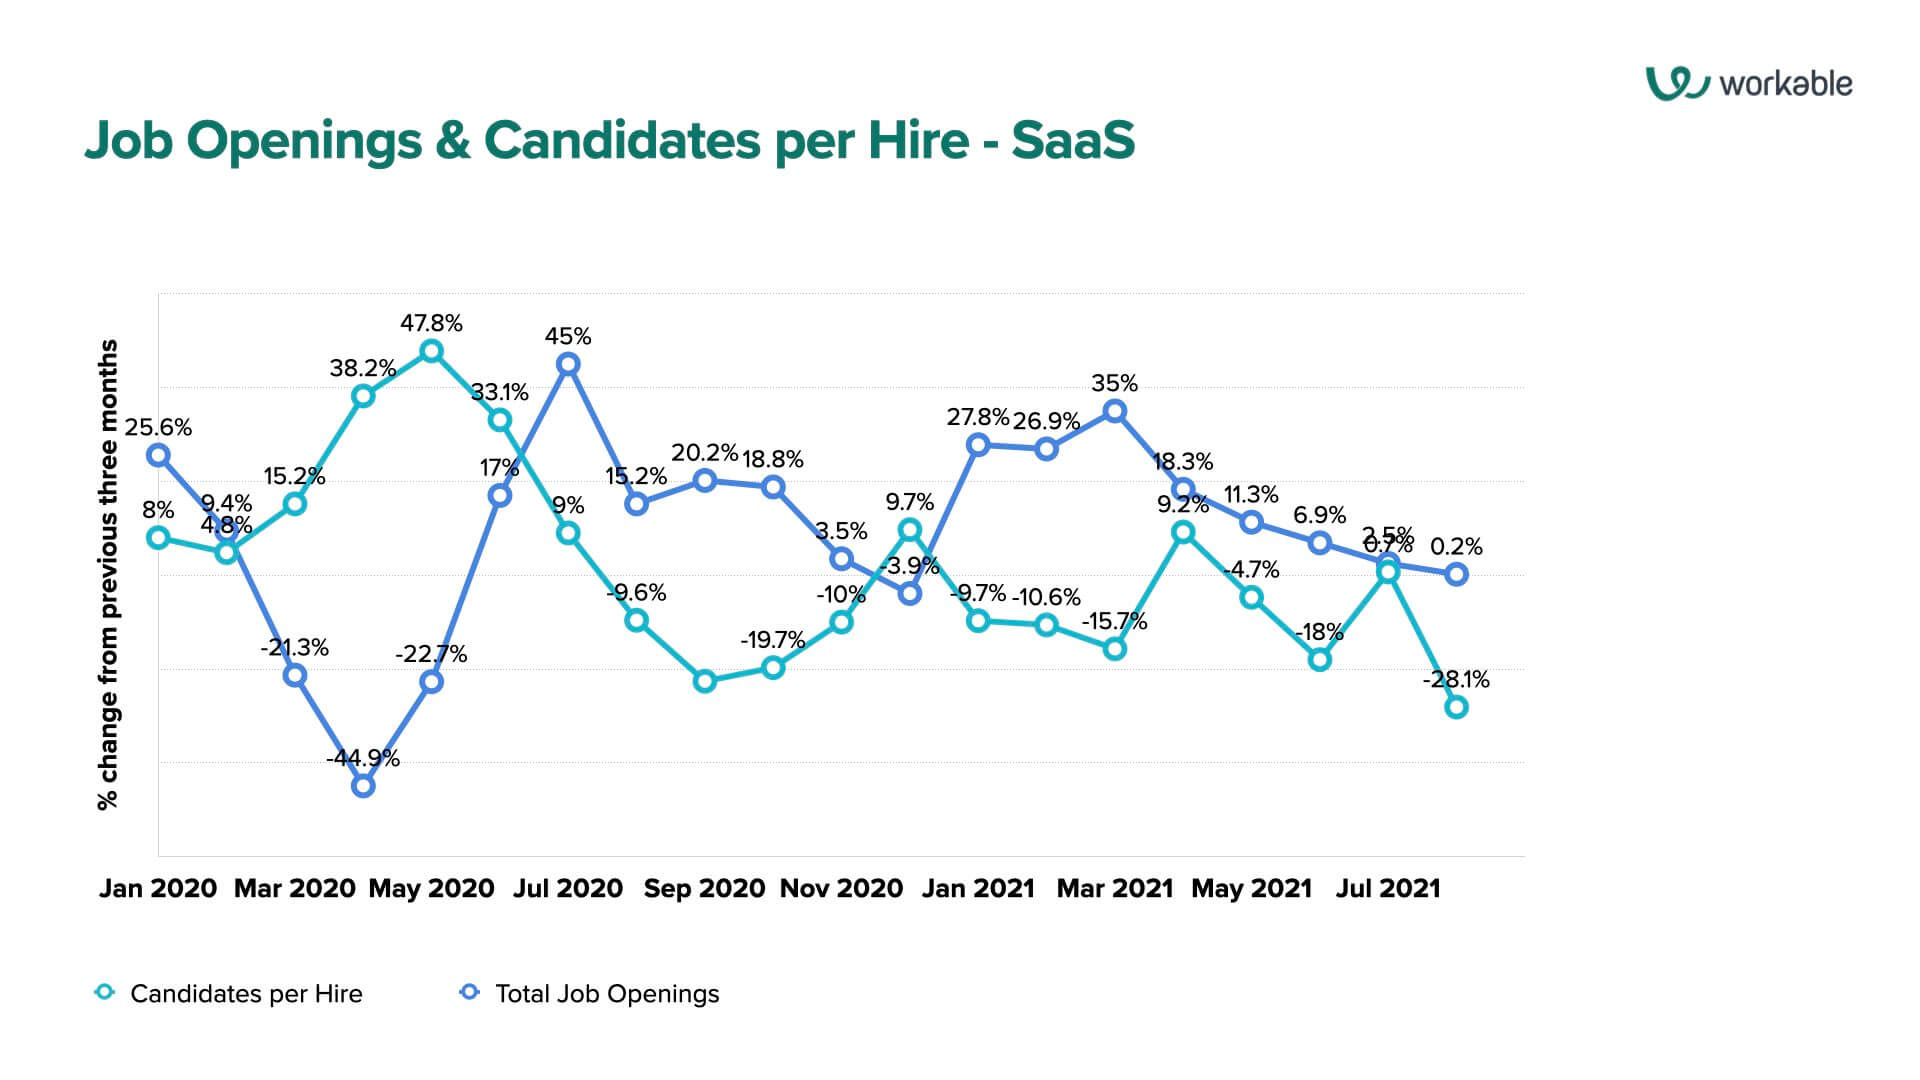
Now, let’s look at total job openings and CPH for the SaaS sector:
Pretty dramatic stuff here. Job openings plummeted at the start of the pandemic as SaaS and other SMBs reduced or froze hiring – and laid off employees – as they shifted to survival mode.
Then in June 2020 onwards, job openings surged and candidates per hire dropped measurably through to Q4 2020 likely in response to steady and increased DX needs, where SaaSers hired at a torrid pace to further develop their tech to meet that demand. Finally, the numbers start to stabilize at the end of 2020 before seeing another surge in the first three months of 2021.
As we pass through mid-2021, we’re still seeing a moderately positive trend in job openings – yet a sharp downward trend in CPH during the same time period with the exception of near-zero change in July 2021 compared with the trailing three-month average.
Retail
The second area we’re looking at is Retail, specifically because it’s one of the hardest-hit sectors when it comes to job quit rates in the United States according to the US Bureau of Labor Statistics. According to JOLTS, it’s second only to Accommodation & Food Services with a quit rate of 4.4 – meaning, 4.4% of total employment for the month of July.
Time to Fill – Retail
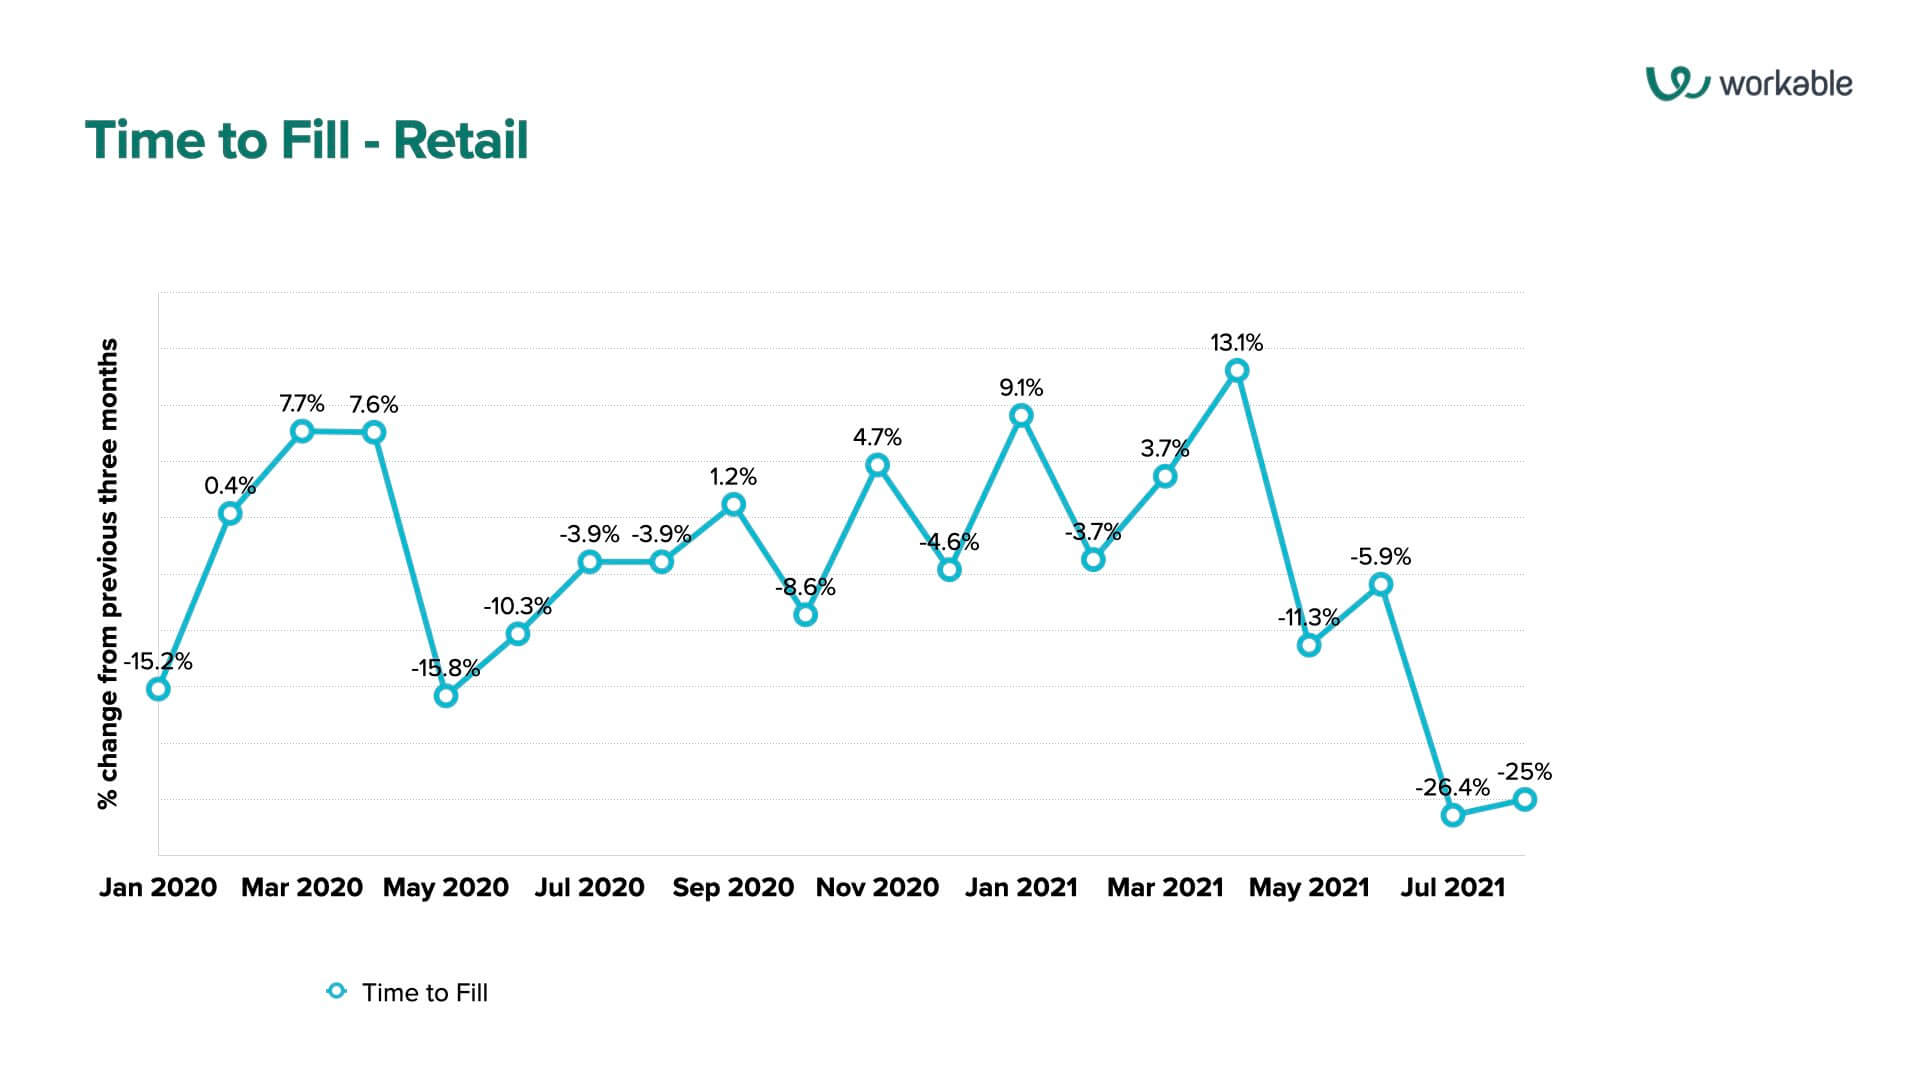
What does TTF for Retail look like in Workable’s network data? Let’s take a look:
Very erratic graph here that can be explained by two things: Retail TTF remained relatively stable from one month to the next throughout this period, making any shift of more than several days a dramatic one when we look at it as a trend compared with previous months.
Secondly, the retail sector is hit hard by the pandemic – as stated in another Deloitte report: “Retail orthodoxies will be challenged, and the industry will likely look much different than when we entered this crisis.” It’s a destabilized time for retail, and that’ll ultimately show in hiring data.
Job Openings & Candidates per Hire – Retail
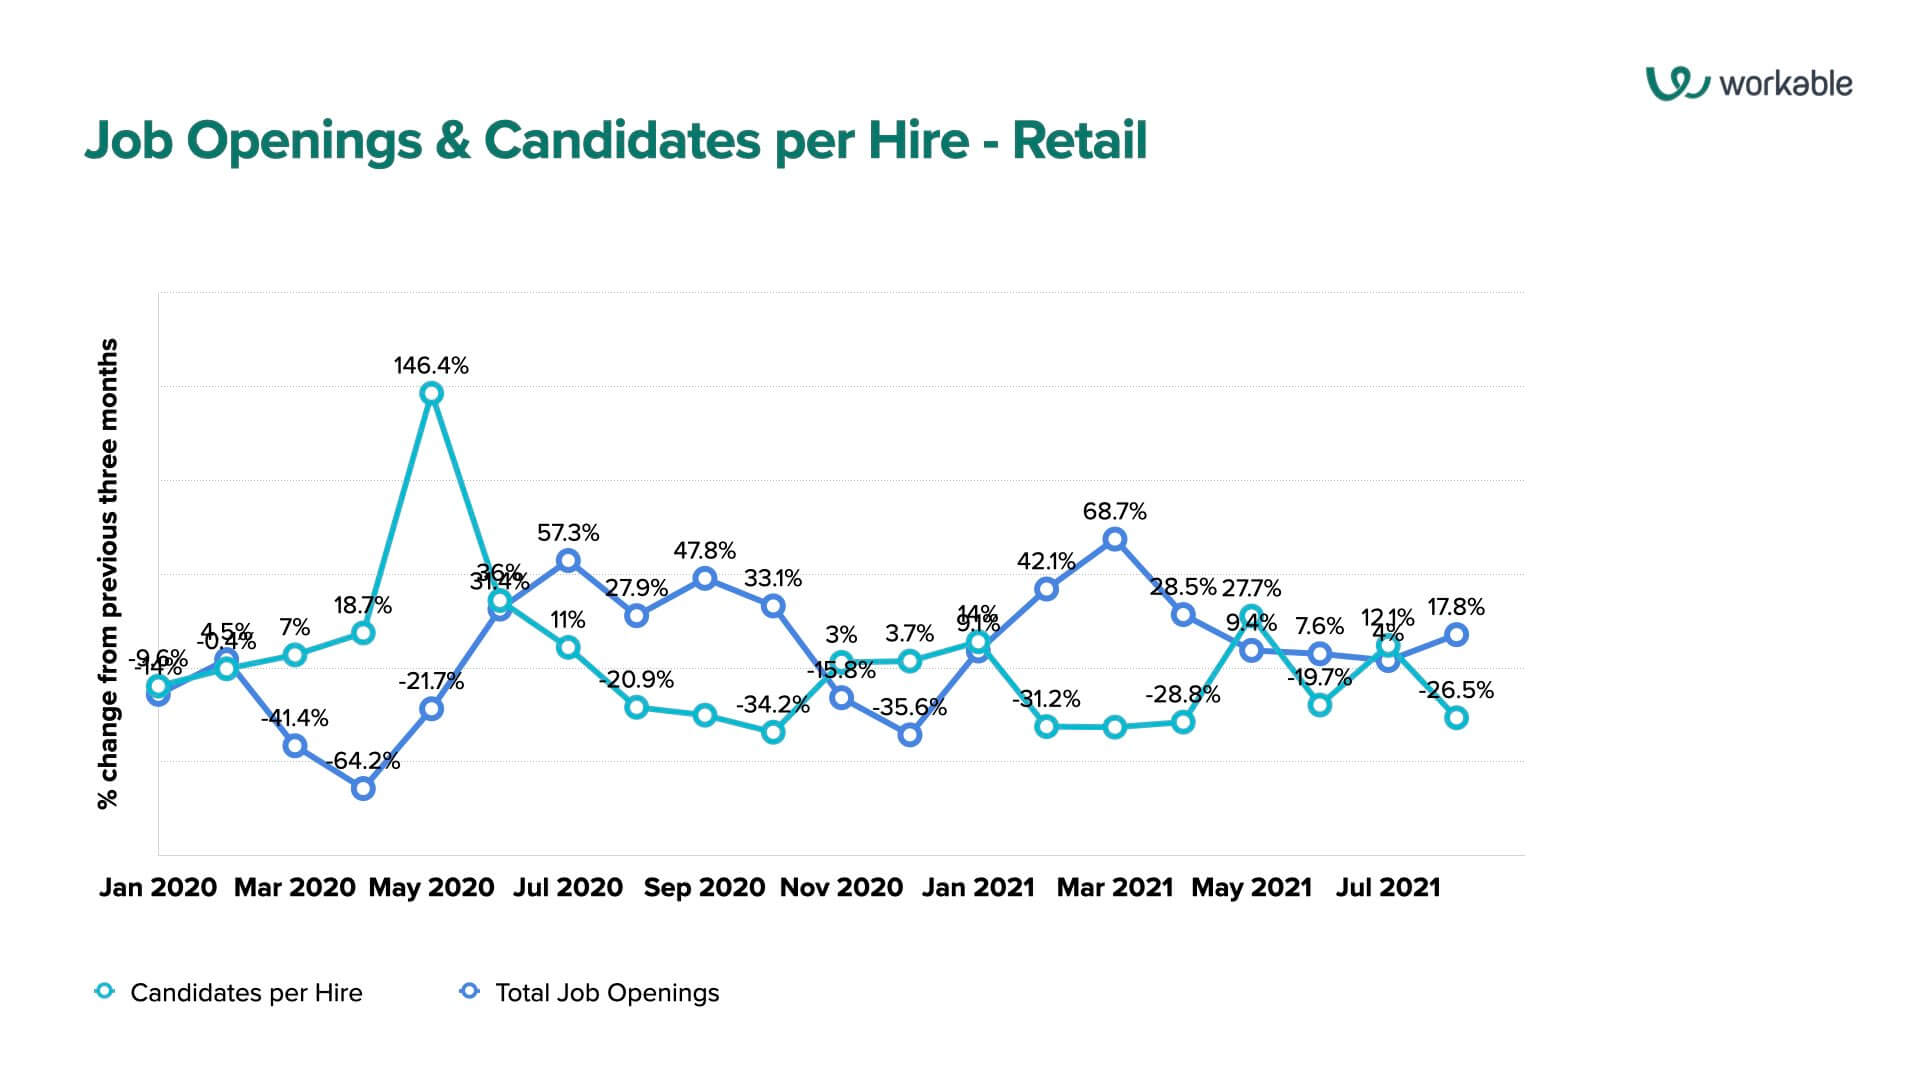
Now, let’s look at the job opens and CPH for retail:
No surprise here. As consumerism took a dive in early 2020 and people stopped going out and spending their money, retail outlets suffered and many shut down – as in SaaS, we see a surge of candidates who had flooded the market as a result. After enduring a particularly tough COVID-19 winter in the United States and Europe, cases dropped significantly across the board and we see a surge in job openings to the end of Q1 2021 as retailers started opening up again.
Moving through Q3 2021, we see job opening trends continue at a positive rate. CPH numbers continue to trend downwards however – despite an uptick in July – likely as a reflection of the Great Resignation.
Real Estate
And finally, we take a look at Real Estate. Home prices and home sales are just going through the roof since the onset of the pandemic – we can surmise on the “why” of it, but let’s focus on the recruitment metrics here. When there’s much more activity in this sector, there’ll be more employment opportunities, right?
Time to Fill – Real Estate
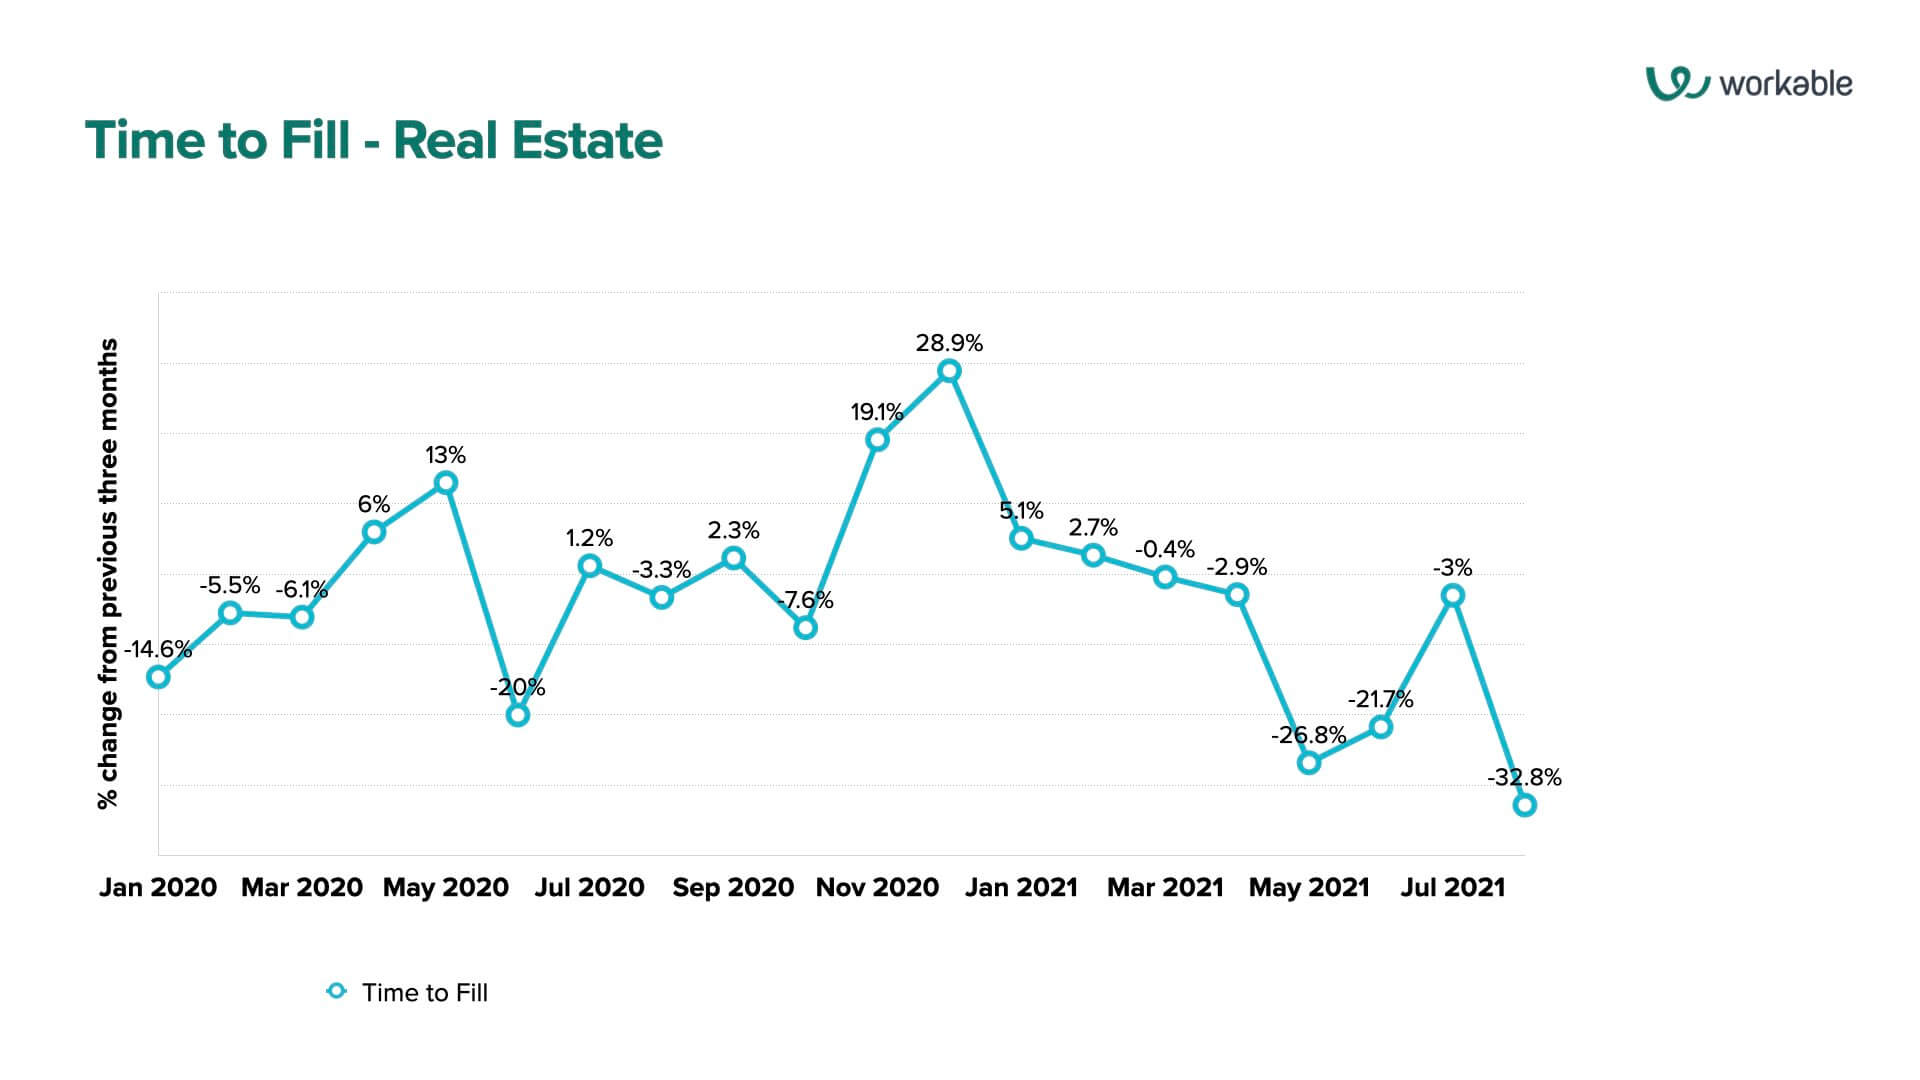
So, let’s look at Time to Fill for the Real Estate sector:
Real estate sales are often seasonal – they rise in the summer months and cool down when the weather gets colder. Pandemic aside, we see this in the TTF metrics – less urgency is put on real estate hires at the end of 2020 and start of 2021.
As real estate heated at a torrid pace through March/April/May 2021, TTF dropped significantly, valleying in May with a 26.8% drop in time to fill compared with the three previous months. Don’t let that spike in July 2021 fool you – it’s still a negative trend of -3%, meaning TTF is still shortening every month even after dropping so dramatically in Q2.
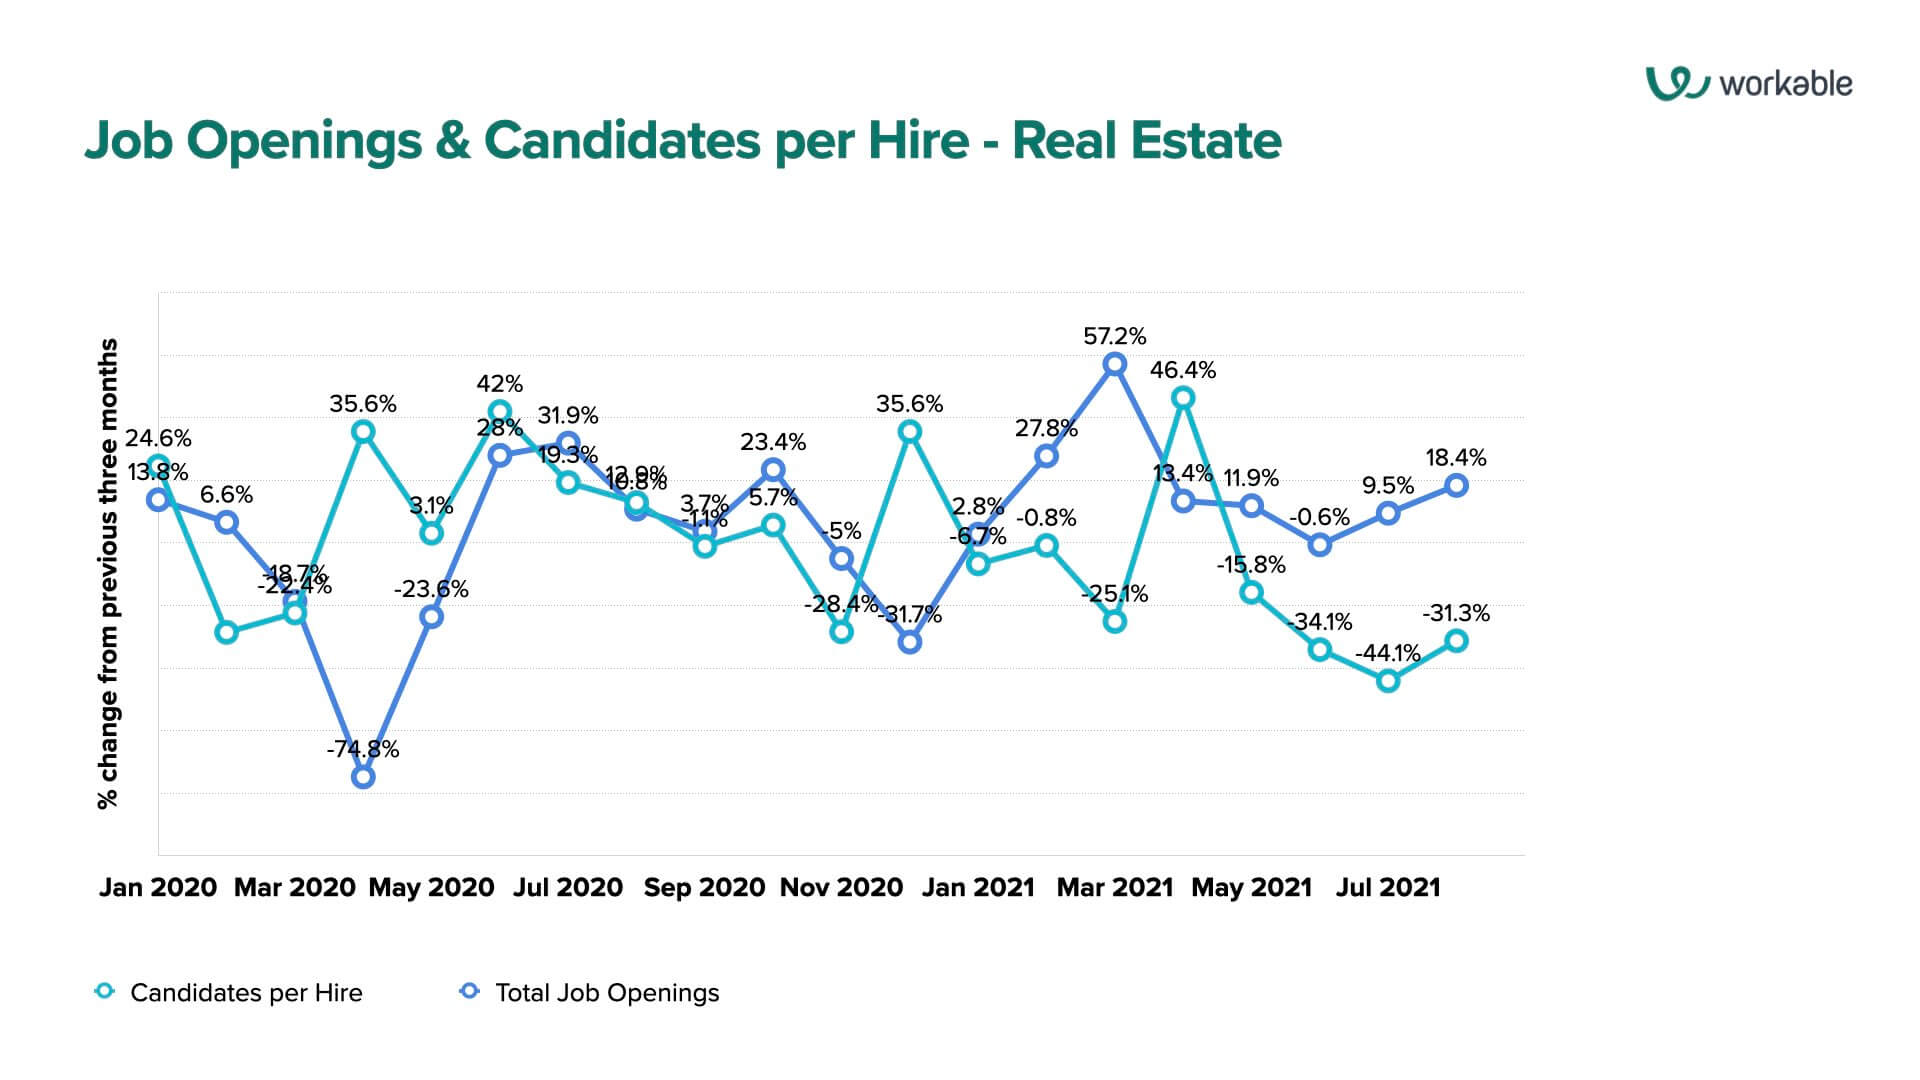
Job Openings & Candidates per Hire – Real Estate
Now, let’s look at the job opens and CPH:
Now what’s very interesting here is that the numbers here for retail feel like a fun-house mirror version of the overall data. Overall, June, July and August show a positive trend for job openings with 6.8%, 6.7%, and 2.4% per month respectively, compared with -0.8%, 9.5%, and 18.4% in the real estate sector.
We see similarly dramatic differences in CPH data: overall, June, July, and August show a negative trend of -12.7%, -9.6%, and -27.3% per month respectively, compared with a much more negative trend of -34.1%, -44.7%, and -31.3% for the same three months in real estate.
That is a huge downward trend right there. One might suggest that this is partly a consequence of the Great Resignation, but JOLTS data places real estate only in the middle of the list of sectors when it comes to job quit rates.
Maybe it’s just an organic shift in career choices. Perhaps there’s skittishness about real estate in that the bubble might eventually burst – and so, job applicants are applying for jobs that have more assurance of longevity and security.
Conclusion
Something to think about: in recruitment metrics, September will prove to be a catalytic month. Reuters reported at the start of September that U.S. childcare workers are in short supply – which would have a domino effect on workers, especially mothers, who must make concessions in their working schedule to accommodate their younger children.
Combine that with uncertainty around Delta – and whatever new variant may be around the corner – and we still have a lot of uncertainty.
Yet, we don’t have all the data in front of us as the calculations for Time to Fill and Candidates per Hire data are not complete for more recent jobs – when a job takes a month or two to fill, we’ll be in November before we have reliable numbers to look at for September. Our Hiring Pulse comes out on the first Tuesday of every month – we’ll have something for you then.
Thoughts, comments, disagreements? Send them to [email protected], with “Hiring Pulse” in the subject heading. We’ll share the best feedback in an upcoming report. Watch for our next Hiring Pulse on Nov. 2!
The Hiring Pulse: Methodology
To bring the best insights to small and medium businesses worldwide, here’s what we’re doing with our data: when looking at a specific month’s trend, we’re taking the numbers from that month and comparing it to the average of the three previous months – and showing as a percentage how that month looks in comparison.
For example, if July shows an average Time to Fill of 30 days for all jobs, and the monthly average for the three preceding months (April, May, June) is 25 days, we present the result for July as a 20% increase.
The majority of the data is sourced from small and medium businesses across the Workable network, making it a powerful resource for SMBs when planning their own hiring strategy.

