How to track hiring velocity with Workable


Hiring velocity is the average amount of time it takes to move a candidate from one hiring step to another. Tracking this metric tells you how quickly your hiring team makes decisions at each hiring stage and how efficient your overall process is. This information helps you spot any problems, work on fixes and track improvements over time.
For example, imagine your hiring teams take an average of 10 days to move candidates from the day they applied or were sourced to the first screening call. Considering that some of the best candidates are off the market in fewer than ten days, you might not be able to hire the most qualified candidates. Also, a longer hiring process may exhaust candidates and contribute to a negative candidate experience that hurts your employer brand.
Track hiring velocity to identify the need to speed up your hiring process steps.
Looking for better reporting analytics? Workable’s reports will refine your recruiting process. Request a demo to learn more today.
Why should I use Workable to track hiring steps?
To track any metric without an automated system, you might use spreadsheets and input your data manually. This not only creates risks for inaccurate or incomplete data, but also places a burden on recruiters who need to spend time managing spreadsheets and formulas. Specifically for hiring velocity, you’d need to:
- Track the dates that each candidate advances to a certain hiring stage (e.g. a candidate has an interview on Nov. 5th while another might go through a screening call on Oct. 4th.)
- Create subtraction formulas to calculate the days in-between two dates (e.g. 10/24/2017 – 10/06/2017 = 18 days.)
- Create formulas to calculate the average hiring velocity at each stage.
This method may be effective if set up correctly, but it’s burdensome to maintain.
To make your life easier, Workable records every recruiting activity throughout your pipeline, and can create reports that help you understand and improve your hiring process steps. Workable’s PRO plan comes with an advanced reporting suite that includes the Hiring Velocity Report to help you evaluate your speed of moving candidates to different hiring stages.
To compile this report and help you see which stages lag and which are faster, Workable automatically:
- records dates;
- calculates days and averages; and,
- displays charts and tables you can easily study and share.
Read on to see what Workable’s hiring velocity report looks like and how to generate it.
How to track hiring velocity with Workable
When you’re logged in to Workable you can access your hiring velocity report easily via the pie chart icon in the main menu bar.
![]()
Choose to see reports for a particular job or department, or generate a report for all active or archived jobs. Select your preferred time frame and you’re ready to study your report.

Review the data
Average days to move forward from stages
At the top of the page, the stacked bar chart shows every hiring step in the pipeline and the average time a candidate takes to move forward from each stage:
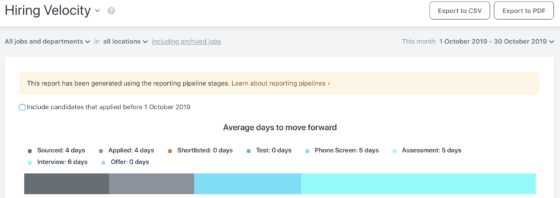
For example, if the bar chart shows “Applied: 7 days” that means it takes an average of seven days for candidates to move forward from applied to any other stage in the pipeline. Similarly, it takes an average of 15 days to move forward from the screening call stage, based on this sample chart.
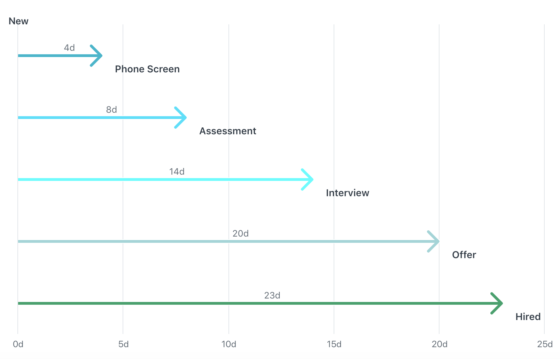
Average days from sourced/applied to pipeline stage
This is represented as a simple chart. Each pipeline stage is a different color, and the number of days is clearly visible above each arrow:
For a more in-depth study of your hiring velocity, Workable has created a table displayed below the charts, which shows data on:
- The average days from sourced/applied to each stage in the pipeline.
- The average days to move forward from a pipeline stage.
- Additional relevant actions that occurred within each stage (e.g. comments and evaluations.)
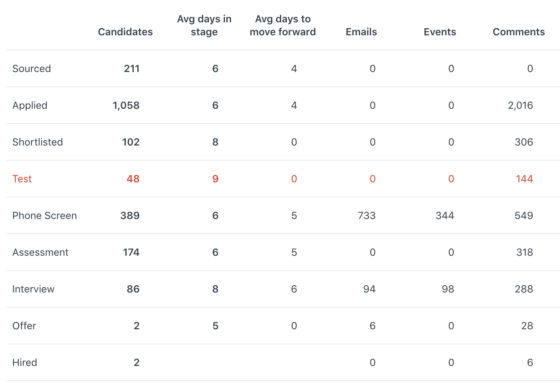
For example, you can see at a glance how many comments your hiring team exchanged at each stage of this pipeline, and compare this number to the amount of time spent in each stage.
To study or present the data more easily, you can export the Hiring Velocity report in CSV or PDF format. Compare the hiring velocity of each stage with time spent on other hiring stages, and your overall time to hire. If you spot inefficiencies, talk to your hiring teams to see what holds them back and discover possible solutions. A quicker and more streamlined hiring process will benefit both your team and your candidates.


