Your Hiring Pulse report for June 2022
What did we talk about last month, in May’s Hiring Pulse? Go on, have a look. It delivers a succinct message: be calm and carry on through the rough waters. We’ve been through a lot in the last two years both as individuals and as employers – and just as things seemed to stabilize, another potential tsunami approaches in the form of a recession.


Noted economist Robert Shiller said as much, in an interview with Bloomberg. A recession is coming, and in his words, it’s a “self-fulfilling prophecy” – because all the talk of a recession is motivating decision-makers to make decisions in anticipation of a recession… and therefore, triggering a recession.
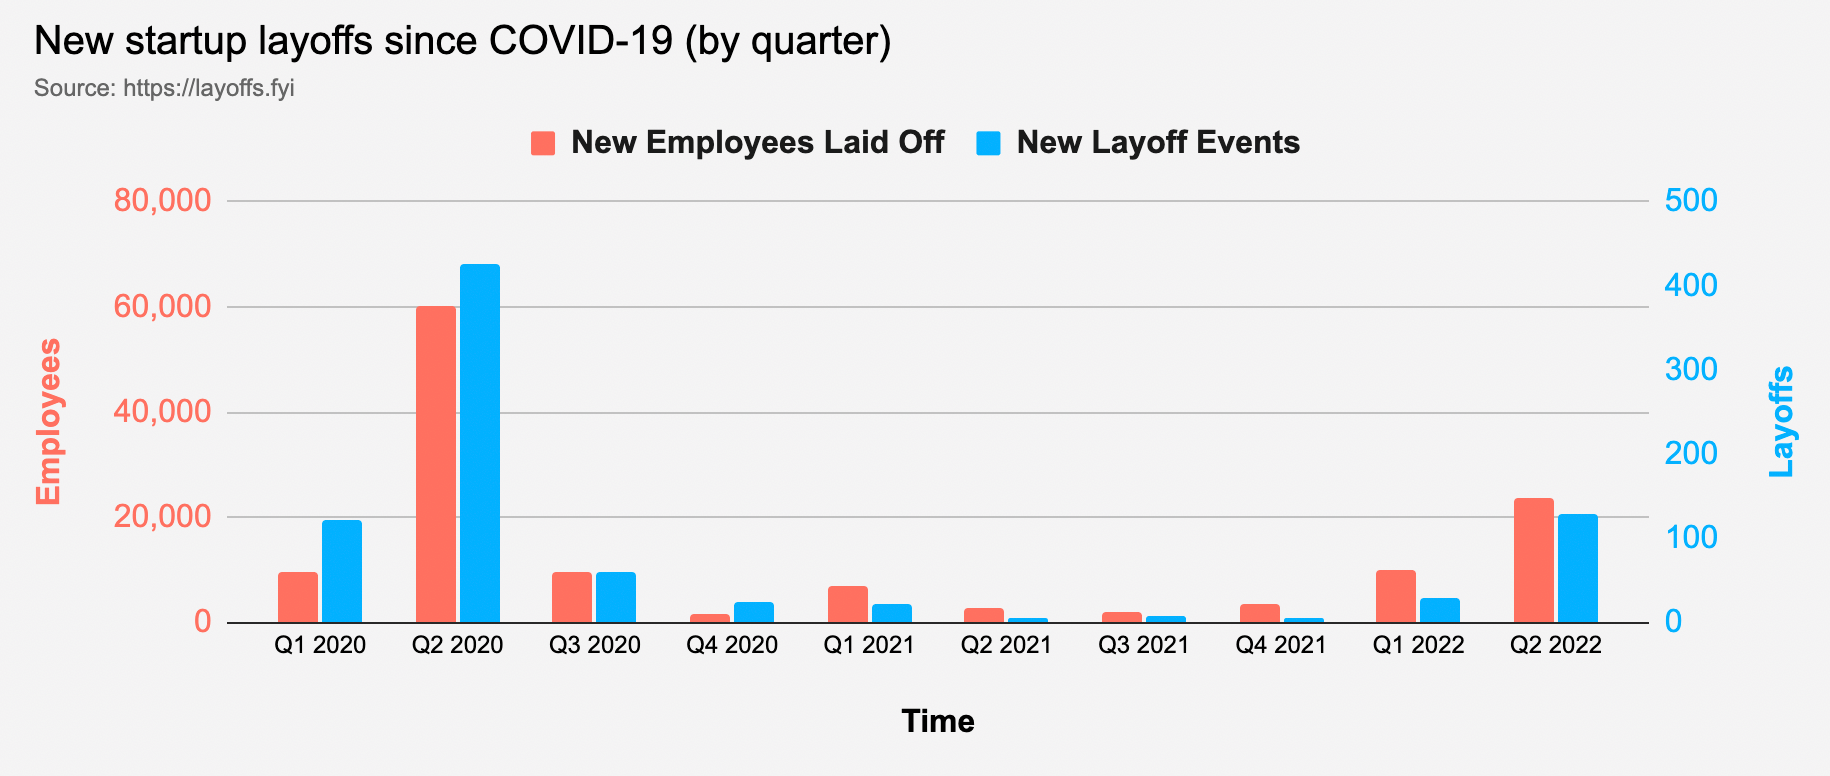
Those decisions include layoffs, of course – the go-to formula for many SMBs who are looking to weather a prospective storm. Y’know, just in case. And the startup tech sector is especially getting hit hard, with more layoffs in Q2 of this year than any other quarter over the last two years since, of course, early 2020:
So, let’s keep that in mind as we dive into this month’s Hiring Pulse, which includes a special look at the hiring data for tech companies.
How we’re looking at data
First, looking at SMB hiring data gives us an opportunity to look at benchmarks in the hiring landscape. But when the benchmark regularly changes during these last two very weird years, it becomes an unreliable gauge.
So, it’s no longer helpful to look at the data YoY or even MoM. It makes more sense to look at rolling trends. Consequently, for the Hiring Pulse, we are looking at percentage increase or decrease compared with the average of the three trailing months. Want a more detailed methodology? Jump to the end and check it out.
As always, we look at the worldwide trends for three common SMB hiring metrics:
- Time to Fill (TTF)
- Total Job Openings
- Candidates per Hire (CPH)
Let’s start analyzing!
Table of Contents:
- Time to Fill
- Total Job Openings
- Candidates per Hire
- Deep dive – tech hiring trends
- Conclusion
- The Hiring Pulse: Methodology
Main highlights
The three main highlights for this month’s Hiring Pulse are:
- The Time to Fill metric is largely the same as in previous Pulses – but the other two metrics are seeing a disruption
- Job Openings are seeing a negative trend unlike what we’ve seen at this time in previous years
- The tech hiring landscape has a life of its own
1. Time to Fill
For this report, Workable defines “Time to Fill” as the number of days from when a new job is opened to when that job opening is filled. It’s important to understand that definition: if a job is opened in October or even as early as April last year, but isn’t filled until May, it won’t count in this graph. If another job is opened on the same day in July or September but is filled on April 30, it does count in this graph.
So, we’re looking at the TTF trends only up to the end of April. Got that? Good. Let’s have a look:
We’d normally go into the usual long-winded spiel about what this chart tells us about SMB hiring up to April 2022 – but honestly, not much has changed or is different from last month. The big drop in the TTF metric begins four months earlier in January – the same trend is shown in our May 2022 report, where the drop begins four months earlier in December.
You might also see here that January’s drop is -12.3% lower than the average of Q4 2021, whereas last month, December showed a much-less dramatic -0.8% drop from the average of the three previous months. Well – we also pointed out the same thing last month. So… again, the point is null. Let’s move on.
2. Total Job Openings
Total job openings represent the total number of job openings activated across the entire Workable network.
So, let’s look at the raw job open numbers – which aren’t contingent on job open/close dates like TTF and Candidates per Hire, so we can include May 2022 in this chart:
The sharp drop from March (20.4%) to April (-0.8%) was noted and expected last month – and there’s also a marginal drop from April (-0.8%) to May (-2.2%).
That’s to be expected, based on last year’s trendline from Q1 to Q2 – but what’s interesting is that this time, the last two months are negative trends. It’s worth noting that over the last three years of Workable’s data, back-to-back negative months only happened in November and December – and of course, in the cataclysmic spring of 2020 which we see as a significant anomaly in hiring trends.
Is this continued negative trend a sign of an oncoming recession? It’s very, very possible.
What Mr. Shiller suggested above about companies becoming more austere in their practices is reflected here – after a seasonally normal Q1 of job opening activity, we’re seeing a relatively stark shift in the opposite direction.
3. Candidates per Hire
Workable defines the number of candidates per hire (CPH) as, succinctly, the number of applicants for a job up to the point of that job being filled.
Let’s look at what’s going on here through April:
(NOTE: Again, as in the TTF chart, you’re probably wondering why we stopped the numbers in April. Again, as stated above, that’s because these data are based on the time the job was opened, not when it was filled.)
Last month, we pointed out how the CPH metric stabilized over the first three months of 2022: -10.1% in January, -8% in February, and -13.9% in March.
That Q1 stabilization holds relatively steady this month, but now we see something: an uptick from the January/February/March average to -4.4 in April.
Nonetheless, that still signals a continued downturn in CPH, even as job posting activity slows down. As we mentioned last month, you’d rightfully deduce that fewer jobs = more candidates per job, but that’s not happening here.
Deep dive – tech hiring trends
Now, let’s dive deeper into one area that’s seeing considerable disruption in recent months – the SaaS sector. If you’re a tech SMB or tech startup, these data trends will be of interest to you.
First, a quick reminder of the layoffs mentioned in the intro. From the same website, we see this chart, this time showing layoffs month by month:
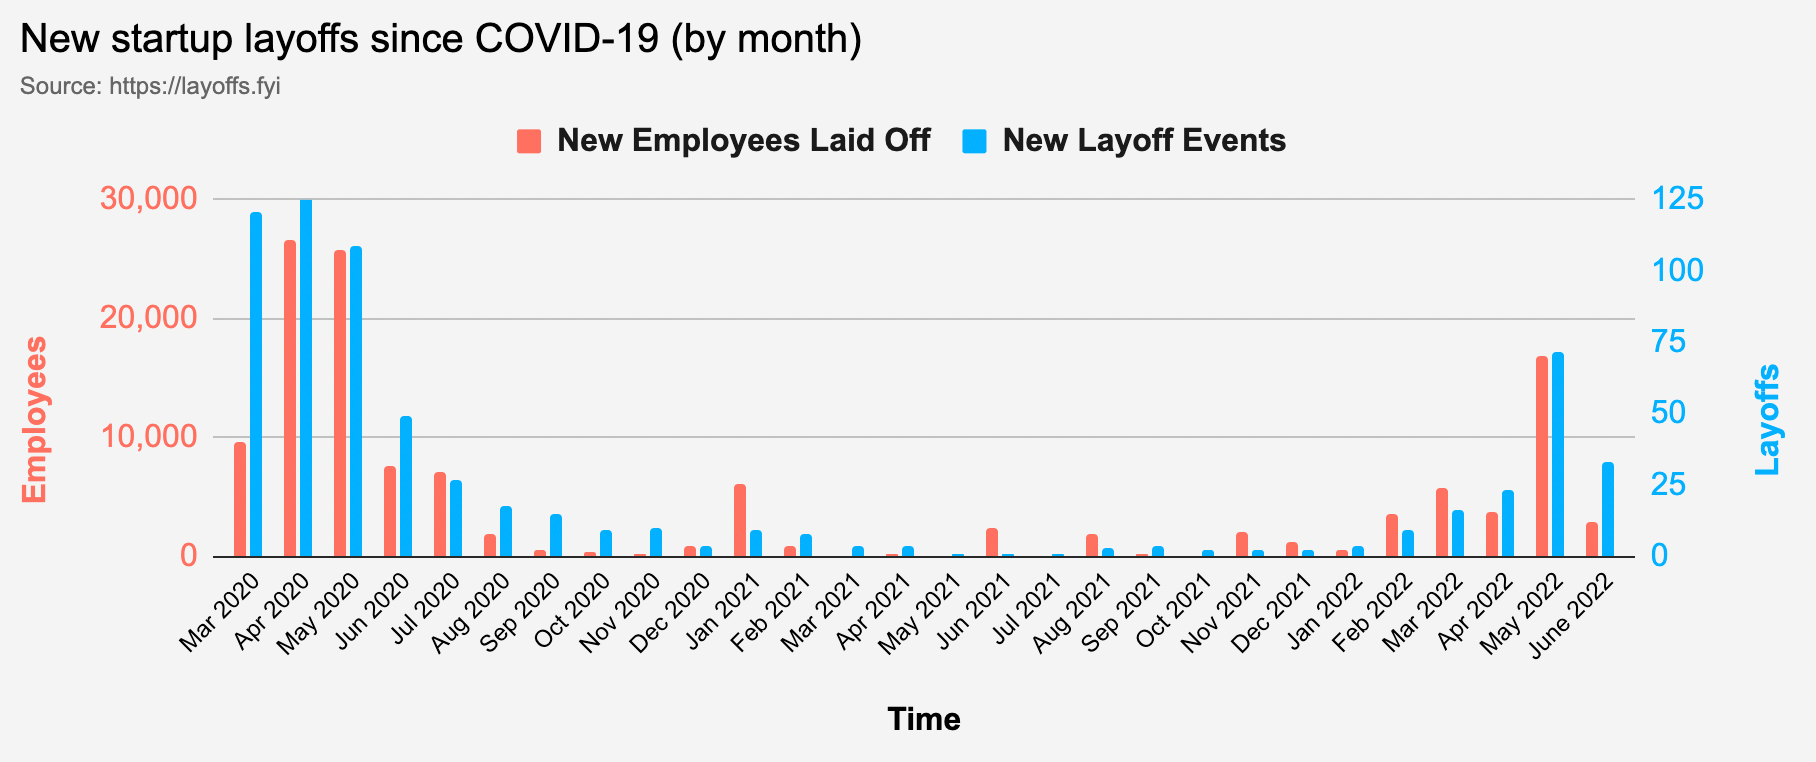
May saw a huge amount of layoffs in startups – and as of the halfway mark of June, we’re already more than halfway to May’s total layoff events.
So, is this unique to tech? Let’s see for ourselves, by comparing the tech sector’s hiring trends with the overall hiring trends in the same charts.
Time to Fill in Tech
First, let’s look at the TTF trend in tech and see if it’s any different from the overall TTF trend.
From afar, the trendlines look very similar. The huge spikes at the start of the pandemic and again going into Q4 of 2020 followed by relative normalcy throughout 2021 – this looks roughly similar for both SaaS and the overall landscape, with some relatively minor variations of course.
But then, as we venture into the last quarter of 2021, we see some noted differences. For instance, October’s TTF trend in tech and software is -4.6%, whereas the overall trend is a very different +1.8% – a point differential of -6.4.
Now, let’s look at the other two metrics.
Total Job Openings in Tech
Now, job openings (JOs) in the SaaS world:
Again, from far away, the trendlines look similar. But zoom in, and you notice some differences, for example:
- The JO trend in tech doesn’t drop nearly as drastically in April 2020 (a difference of +6.7 percentage points), and doesn’t rise nearly as drastically over the next few months after that (percentage point differences of +0.5, -3.3, –4.1, and –7.7 for May-August respectively);
- The JO trend in tech rose higher than the overall from October 2020 to January 2021 (point differences of +6.4, +6.5, +4.6 and +5.2 respectively);
- With the exception of December 2021, the JO trend again rose higher than the overall from October 2021 to January 2022 (+4.3 points in October, +5.5 in November, -2.6 in December, and +4.6 in February;
- And finally, the tech JO trend is much lower than the overall trend for February (-6.5) and April (-6.8) of this year.
Candidates per Hire in Tech
And finally, candidates per hire:
The differences between the trend in tech and overall stand out much more here. What stands out for 2020 is how CPH in tech is much higher than the overall average for May (a positive difference of +10.5 points) and June (+12.1 points), but then swings sharply in the opposite direction for July (-7.2 points), August (-5.4), and September (-8.5).
We also see a 17-point positive differential for April 2021 in favor of SaaSers, and another positive differential in February 2022 (+12.5). But then, February 2022 is followed by an almost identical pendulum swing to -12.6 points – a total shift in the tech vs. overall CPH trend of 25.1 percentage points in just two months. That’s huge and it signals something very unique happening in the software space.
Conclusion
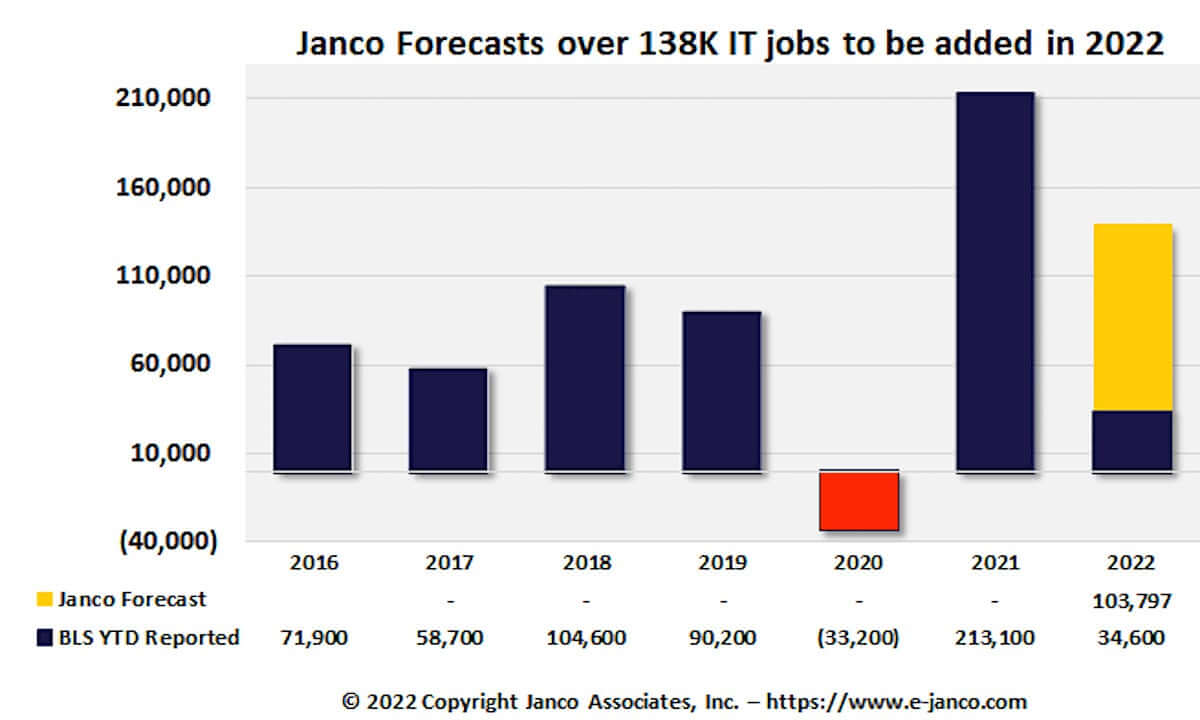
ComputerWorld’s very in-depth analysis of the American IT job market bluntly calls out the significant growth in IT jobs in the calendar year 2021 – in fact, more than twice as high as any previous year.
A quick conclusion might be that this is job recovery from 2020, but even then, the cumulative IT job loss in the US for 2020 was just 33K – a small percentage of the 104K tech jobs added in 2018 and 90K jobs added in 2019, and of course, the 213K jobs added in 2021.
The increased digital transformation of the worldwide economy – be it in supply chain, finance, and even the cannabis trade – over the last two years since the pandemic required us to go online more often in every aspect of our lives. So that brings a lot of demand for tech – hence, more jobs for tech workers.
It follows that the tech sector is a volatile beast very much subject to boom-bust cycles – we’ve seen this dating back to the dot-com frenzy of the late 1990s. While tech is part of the overall economy, it also runs on the lifeblood of its own unique subset of the economy.
And now, tech layoffs are all over the news. It may be the first signs of an oncoming recession, with tech, being one of the most agile sectors, leading the charge in terms of austerical adjustments. If you’re one of the companies planning layoffs, you’ll probably need to think about how to go about it tactfully and without irreversibly causing damage to your reputation as an employer.
A sign of things to come? Let’s keep an eye on the upcoming Hiring Pulses and find out.
Thoughts, comments, disagreements? Send them to [email protected], with “Hiring Pulse” in the subject heading. We’ll share the best feedback in an upcoming report. Watch for our next Hiring Pulse in May!
The Hiring Pulse: Methodology
To bring the best insights to small and medium businesses worldwide, here’s what we’re doing with our data: when looking at a specific month’s trend, we’re taking the numbers from that month and comparing it to the average of the three previous months – and showing as a percentage how that month looks in comparison.
For example, if July shows an average Time to Fill of 30 days for all jobs, and the monthly average for the three preceding months (April, May, June) is 25 days, we present the result for July as a 20% increase.
The majority of the data is sourced from small and medium businesses across the Workable network, making it a powerful resource for SMBs when planning their own hiring strategy.

