Workable’s most-used recruiting reports and how to use them

If you’re a talent professional, you already know that you need to demonstrate the value of what you do on a regular basis. Whether it’s time for performance reviews and you want to discuss results of your work with your boss, or you want to show upper management the value of the ATS system you just brought into the fold, recruiting metrics and reports will help you prove your point.
But where do you start? If you’re like many of the Workable users I engaged with on a regular basis during my two years in account management, you’re looking for clear reports and numbers. Keeping a spreadsheet with all the hires you’ve made or all the interviews your team conducted doesn’t really portray your work. That’s because a spreadsheet is hard to maintain manually as your company is growing and, also, it doesn’t give you complex information, such as the bottlenecks of your hiring process or comparisons between different quarters and departments.
For this type of information, you need a system in place that will make all the calculations for you, so that you focus on analyzing the outcomes, improving your processes and building a case for new tools or new hires. When you come to me with this kind of request, I’ll usually show you my favorite recruiting reports – the ones that customers across all industries visit and interact with the most.
How to measure recruitment effectiveness
Recruiting reports: Most Visited
1) Current Pipeline Report
Why?
The Current Pipeline report is your recruiting snapshot. Similar to the Dashboard that you see right when you log in to Workable, this report shows you what’s going on with each job. How long has it been open for? Is the pipeline full? You can even break down each position by stage to gather more specific information: Where are the bottlenecks and what are the holdups at each stage? What areas do you need to focus on?
For example, by looking at your Current Pipeline Report, you can learn that 20 candidates have applied for the Software Engineer role, but nobody from your hiring team has screened them yet. So, you might want to emphasize on that stage now.
Here, you can view the aggregate of your pipeline stages across specific jobs or departments:

In the above screenshot, you can see that there are 193 candidates in the phone screen stage. This could be a hint that you might want to speed up this part of your hiring process, by using, for example, an auto-scheduling tool.
Who is this helpful for?
This recruiting report is especially useful if you are – or if you report to – the head of talent or HR at a large company. You’ll get a pulse on the current hiring process. Knowing this kind of high-level overview helps you shift your team’s focus to specific areas and identify priorities and opportunities for optimization.
Tip: Nearly all recruiting reports can be exported to PDF. This can prove to be incredibly helpful collateral at those quarterly meetings where your boss or someone from Finance wants an update on the hiring process and current open roles.
2) Candidate Breakdown Report
Why?
The Candidate Breakdown report is among the most exported recruiting reports. It allows you to take all of your candidate data out of Workable in a CSV file where you can do a number of things:
- Manage data by yourself on Excel, Google Sheets, etc.
- Create a mailing list to keep past candidates updated on your company
- Track and report on specific candidate information that matters to your company, such as salary expectations, years of experience, etc.
Who is this helpful for?
If you’re a Talent Acquisition or People Management specialist, you’ll find that the Candidate Breakdown report allows you to build an offline database for safekeeping. You can also derive datasets that may be used in larger scale reports.
Note that when you export and store candidate data, you need to make sure you comply with data protection regulations, including GDPR and your company’s privacy policy.
Recruiting reports: Most Interacted With
1) Historic Pipeline Report
Why?
The Historic Pipeline report has always been my favorite report to show. That’s because it measures the effectiveness of the recruitment process. Our Time to Hire report shows how long it takes you to hire for a position, but the Historic Pipeline shows you why it takes that long.
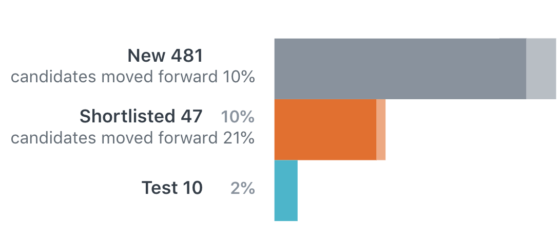
Let’s see how it works. You have probably organized your hiring process into stages. Each stage is supposed to identify the best candidates and dismiss the others. Here’s what the Historic Pipeline report looks like:

The darker section of each bar represents the number of candidates who have been left at that stage. The lighter section indicates the number of candidates who’ve been disqualified in that stage. When you only reject, for example, 10% of the candidates from one stage to the next, you’re not much closer to a decision – you’re just delaying the time to hire for a few days. In a war for talent, this delay might just cost you your next hire.
So, going back to the above example, you should probably ask yourself: is the test you’re using (personality, aptitude, etc.) hard or relevant enough? Maybe it’s time to reevaluate this test and use alternative assessment methods to screen candidates more effectively.
2) Candidate Sources Report
Why?
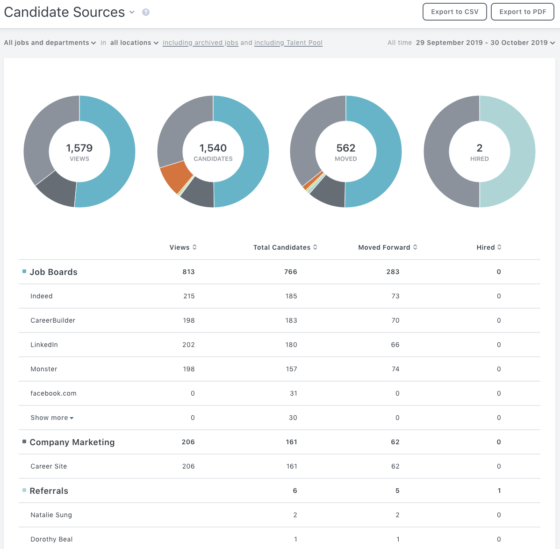
The Candidate Sources report explores your recruiting mix. It’ll tell you where your candidates are coming from as a whole. However, as an HR professional, you’re often more keen to dig deeper. You want to know: where are most engineering candidates coming from – and even better – where are the successful ones coming from? Are we finding engineering talent via LinkedIn? Which avenues are working and which are not? You can get these answers from the Candidate Sources report:

If you notice that your best candidates usually come from a certain job board, maybe it’s worth investing a bit more through premium postings or direct sourcing on that site. Likewise, if your referrals are not successful, you should consider beefing up your employee referral initiatives.
You can also drill down by data range and job to do some A/B testing and get interesting insights. Does rewriting your job description or changing the job title drive more candidates?
Tip: You can use the job shortlink to post your open roles anywhere on the web (niche sites, industry forums, etc.) and Workable will automatically track that source, too.
Something for everyone
These recruiting reports and metrics are useful to everyone who, one way or another, is involved in hiring: from the head of talent and the finance team to hiring managers and recruiters. Using the data you get from these reports, you can make strategic decisions based on facts, rather than impulse or out of habit; you can compare your hiring goals with the actual results, spot areas for improvement and see how your recruitment process gets more effective over time. This way, you’ll decide where your team should be spending time and resources.
These are the most popular reports among Workable customers and often the first reports that I’ll show to new users. They’re a great place to start if reporting is a priority for you. However, it’s always good to outline your company’s KPIs first. You can see a great example from one of our customers, ZeShaan at Onfido, here.
If you know exactly what you’re looking for, Workable can create it for you. I’ve worked with dozens of customers over the years to create specific custom reports. We can even connect you to all of your live data too! For more information, contact our team and we’ll walk you through our reporting suite.
If you’re in tech and want to see how your numbers stack up against the average in your region, check out Key Hiring Metrics: Useful benchmarks for tech roles.


