Recruiting yield ratios, explained
Recruiting yield ratios are key performance indicators (KPIs) used to measure the efficiency of the hiring process. These ratios can provide insights into the effectiveness of different recruitment strategies and sources, help identify potential biases, and guide improvements in the hiring process.


How can companies know if their recruitment process works well? They can avoid leaving the answer to chance by using a few useful recruiting metrics. When used correctly, recruiting analytics can tell you many things. For example, they could let you know whether your external recruiting efforts are paying off. Or, they could reveal diversity and meritocracy problems.
Recruiting yield ratios are some of the most important recruiting key performance indicators (KPIs). Yield ratios are usually used to measure how many candidates were hired from a total number of applications. But, their usefulness can expand beyond that to reflect every stage of the hiring process and source of hire.
Contents
What are recruiting yield ratios?
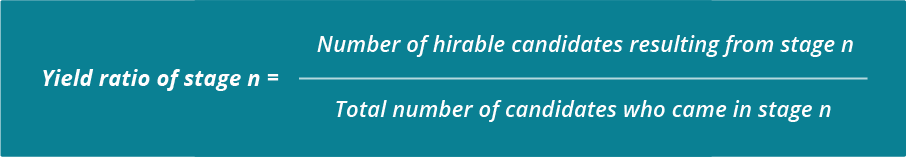
DEFINITION
“Yield ratios show what percentage of candidates pass from one stage of the hiring process to another.”
Calculate a recruiting yield ratio
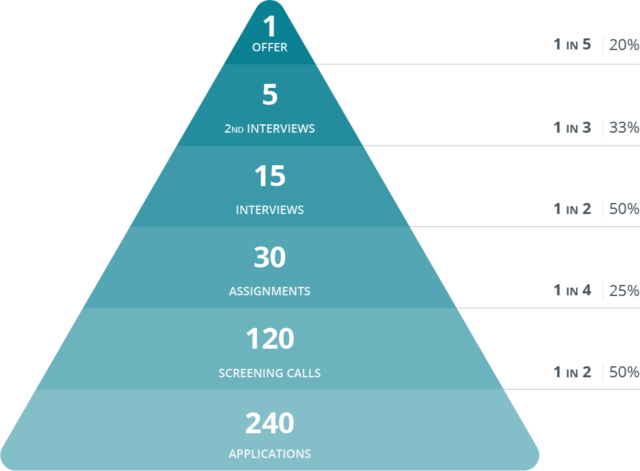
Yield ratios show the efficiency of your hiring process. Here’s an example based on our default hiring pipeline:
A company received 240 applications for a specific position. From these applications, only 120 passed from resume screening to screening calls. Then, 30 were given an assignment. Only 15 were invited to an interview. Five went through to an executive interview. One received an offer. Here’s a recruitment yield pyramid visualizing this hiring process:
Calculate, compare and act on recruiting analytics
Yield ratios in recruitment and selection are often useless as lone percentages. Companies need a continuous process of analyzing data and comparing HR metrics across time. This can help them draw better conclusions.
The more yield ratios decrease over time, the more efficient your process becomes. In the example above, imagine that you interview 10 candidates (instead of 15) in the first interview round, out of the 30 who received an assignment. This signifies a decreased HR yield ratio – only one third (instead of half) of the 30 candidates passed through to an interview, saving your interviewing team a lot of time and effort.
Note that decreasing the number of candidates who pass through each stage shouldn’t decrease quality of hire. It should just mean that you’re employing better screening techniques. Also, when you want to measure the quality of a particular source, e.g. an external recruiter, passing more candidates from the ‘application’ to the ‘screening call’ phase could be a good thing. It could mean that this particular recruiter brings in a lot of good candidates.
The recruitment yield pyramid above could also represent expected ratios when hiring for a specific position. Looking at the pyramid, you can see that 240 applicants will probably result in one hire. This means that if you want to hire three new people, instead of one, for a role (e.g. if you’re expanding your customer support team), you’ll probably need three times as many candidates (720 applicants).
Using this estimate, you’ll be able to guess that, if half of your average time-to-fill has passed and you’ve only received 500 applications, you’ll probably need to rethink your job advertisement or sourcing strategies. The same goes for each stage of the hiring pipeline; if you see that you’ve given an assignment to just 50 people, instead of 90, it might be a good idea to go back and re-evaluate some candidates to improve your time-to-hire.
Yield metrics can also help you figure out whether your recruitment strategies and sources are effective. For example, you could assess an external agency’s services as a candidate source. Imagine you received 200 resumes from an agency and only 5% of them passed through your screening call phase. This low yield could signify a problem. You might need to communicate more clearly with your external agency about position requirements. Or, maybe, the agency’s audience just isn’t right for you.
You could also compare recruitment ratios from different sources like recruitment agencies, employee referrals and job boards to see which source is most effective for you. For example:
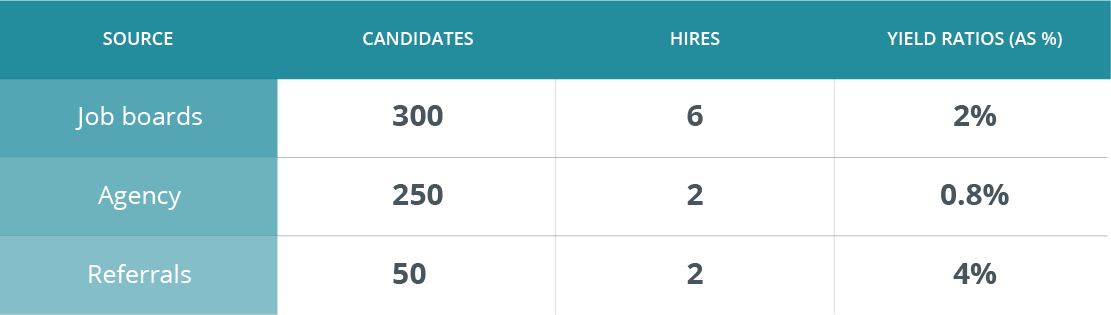
By exploring the meaning behind recruitment yield ratios, you can build a more efficient recruiting strategy. If for example, your yield ratio of qualified hires from pay-per-click job boards is consistently better than your yield ratio from recruiting agencies, that’s something to look into.
Delving deeper into yield ratios
Yield ratios can give you an in-depth picture of your hiring process when they’re analyzed according to certain criteria.
For example, imagine that you calculate the gender ratio for new hires. You find that 20 percent of your total new hires are women. You could perform the same kind of calculation for minorities. For example, you could find that employees of a particular race only make up 1 percent of new hires.
Why is that? Do your job ads discourage female applicants or minorities? Do you advertise in the wrong places? Or, are hiring biases undermining your interview process?
Yield ratios can give an indication of the truth. Let’s break down the numbers. Imagine that out of 240 applicants, 110 are women and 130 are men. These numbers seem relatively balanced. You have an indication that your job ads are probably gender neutral.
Then, you go to the next phase. You could calculate the yield ratio for people who passed through resume screening to the screening call phase. Imagine that, out of the 120 who made it to the screening call stage, 30 were women. The yield ratio would be 27.2% for women and 69.2% for men. One explanation could be that women applicants were simply not as qualified for this position as men. Yet, research shows that women are less likely than men to apply to a position if they don’t meet all job requirements. This fact, along with your low yield ratio, could indicate that there might be a bias problem in your resume screening phase. Hiring teams can tackle these kinds of hiring biases by opting for anonymous interviewing platforms or using tools that conceal candidates’ photos and names when screening resumes.
There are many ways to play around with metrics. Each ratio gives you a hint at something, whether good or bad. If you interpret ratios carefully, and act on solving problems, you’re more likely to make your process fair and efficient.
Note that it’s best to calculate yield ratios per position, or seniority level. For example, in aggregate, you may have favorable minority yield ratios. But you might find minority candidates are well represented in low-level positions, while your executive team is all-white-male.
How do I collect recruiting yield ratio data?
Spreadsheets might be fun at first, when data is limited. But, if you want to monitor annual yield ratio trends in detail, you’ll need a more efficient approach. An Applicant Tracking System (ATS) could help you collect and store detailed data and reports.
Frequently asked questions
- What is yield ratio in recruitment?
- Yield ratios are metrics used in recruiting that measure what percentage of applicants move from one stage to another in the hiring process. They are used to measure the success of various recruiting methods and strategies.
- Why do we use yield ratio in recruitment evolution?
- A yield ratio is a metric used in recruitment to measure the movement of candidates through each step of the hiring pipeline. Tracking this important recruitment metric can help employers identify gaps and opportunities in the hiring process by looking at what percentage of candidates pass from one stage to the next.
- What are KPI metrics in recruiting?
- Organizations use recruitment KPIs to specifically measure activities and results within the recruitment process. They are often presented as single figures, percentages, or ratios to ensure they are clear and easy to understand within Human Resources and across the business.